
Variance Analysis
Excel and Google Sheets Template
What's Inside the Variance Analysis Template?
Details | 6 Sheets
Supported Versions | Excel 2010, 2013, 2016, 2019, Office 365 (Mac), Google Sheets
Category | Management, Finance
Tags | Budget vs. Actuals, Budget, Cost, Sales


Why Professionals Choose Simple Sheets
It's simple. Access to the largest library of premium Excel Templates, plus world-class training.

100+ Professional Excel Templates
Optimized for use with Excel. Solve Excel problems in minutes, not hours.

World-Class Excel University
With our university, you'll learn how we make templates & how to make your own.

How-To Videos
Each template comes with a guide to use it along with how-to videos that show how it works.
Inside Our Variance Analysis
Excel and Google Sheets Template
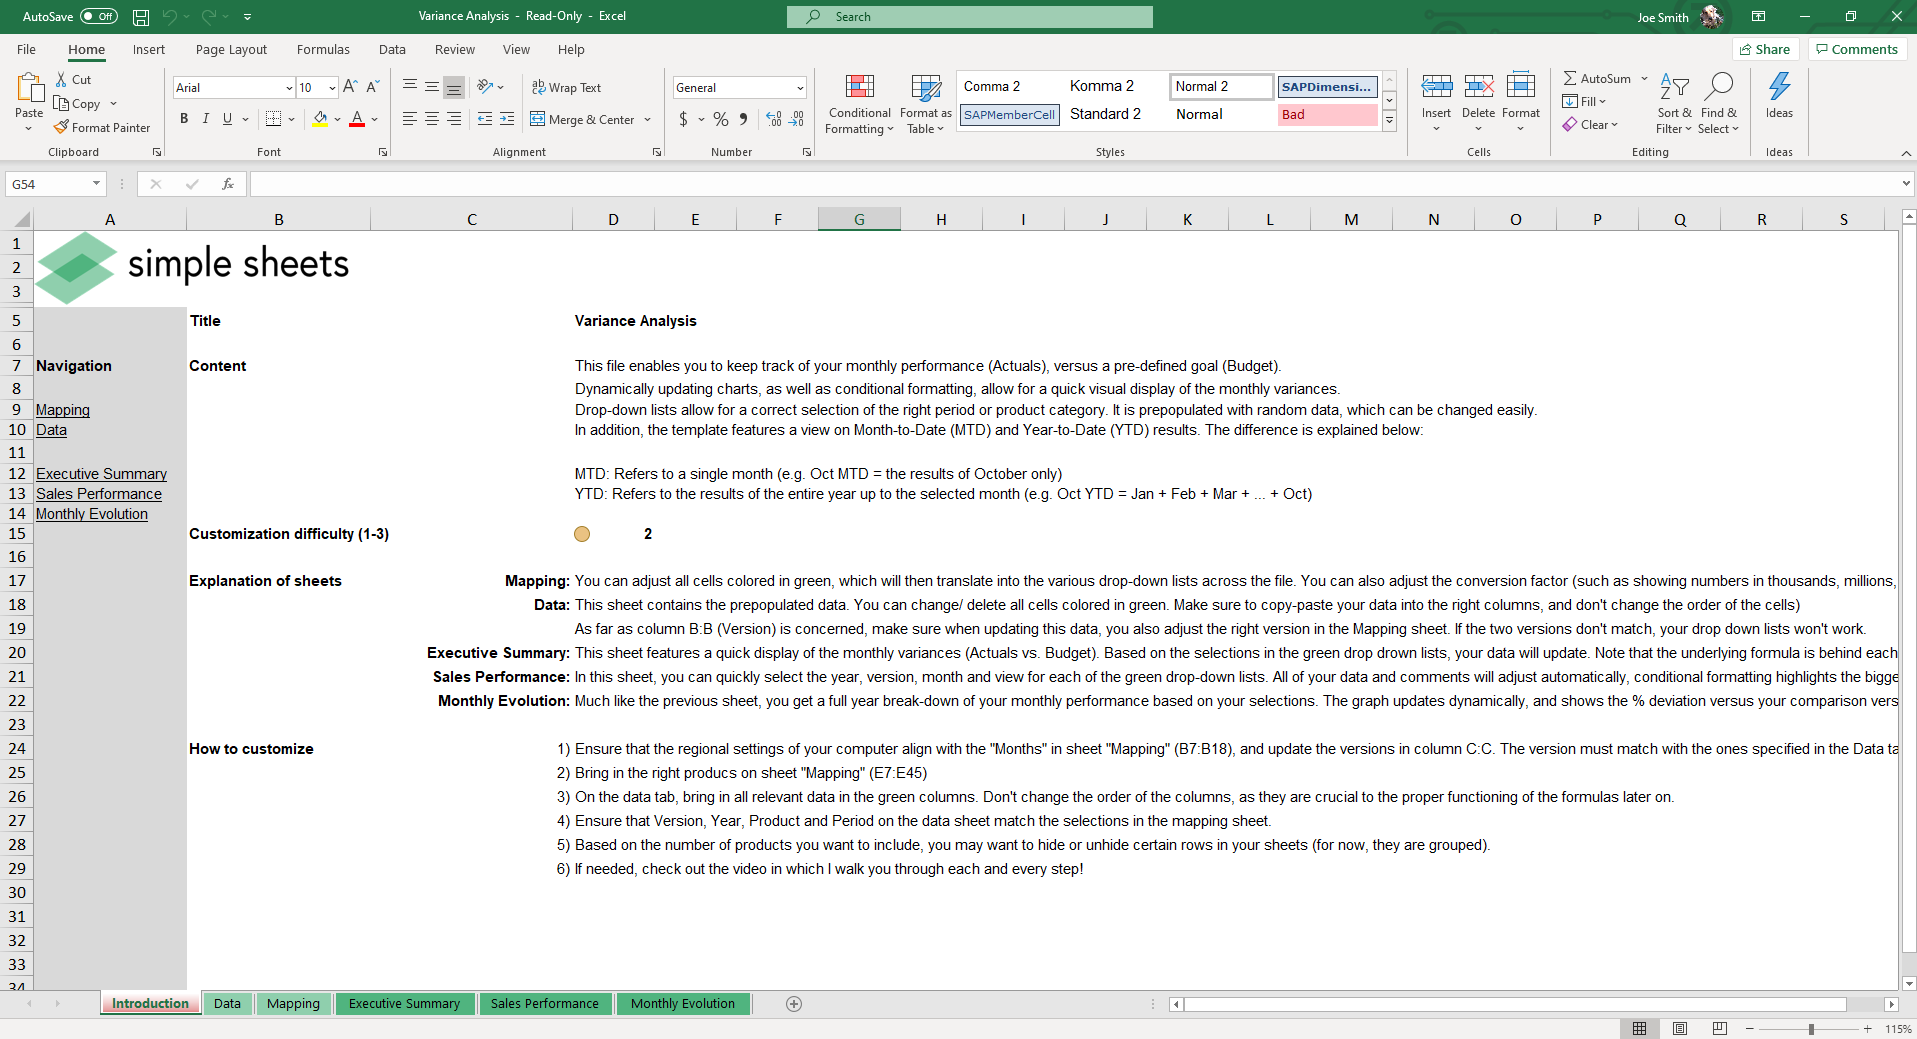
It’s a given that predicting the future is impossible. That doesn’t mean we shouldn’t try.
Variance Analysis is an important analysis that compares planned and actual numbers.
‘Numbers’ can be different metrics like costs, revenue, profit and more. Essentially, it’s used to gauge under-performance or over-performance over a period of time. Because it’s especially popular in the accounting world, it’s also referred to as Budget vs. Actuals.
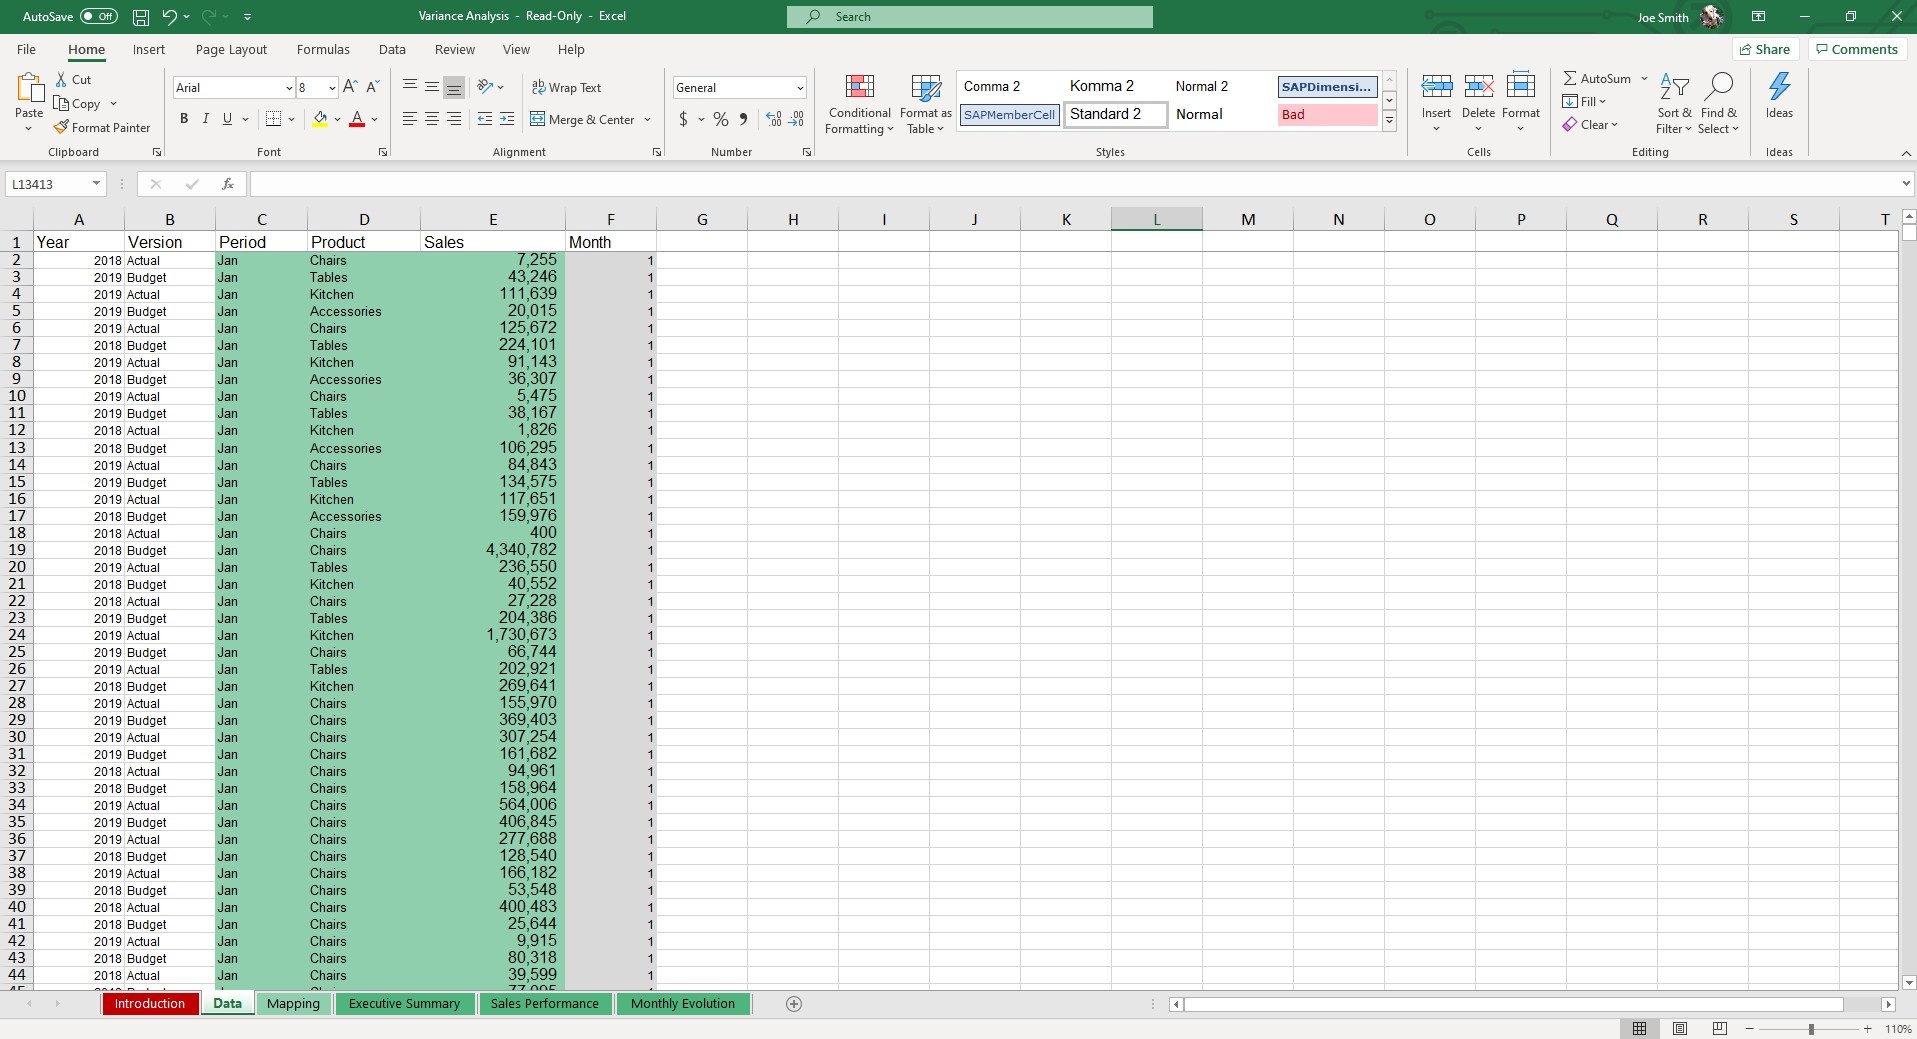
Many other templates we found online for Variance Analysis were very basic. When building this template, we knew that it would not only have to accomodate large sets of data (up to 13,000 rows), but that it would tell a story with visuals.
We’re big on making numbers come to life so they make sense for people who don’t have time to dig through all the data or aren’t ‘numbers people.’ Chances are you need to share data with people who aren’t data scientists or mathematicians. Here’s how we built this template to ensure everyone can understand it.
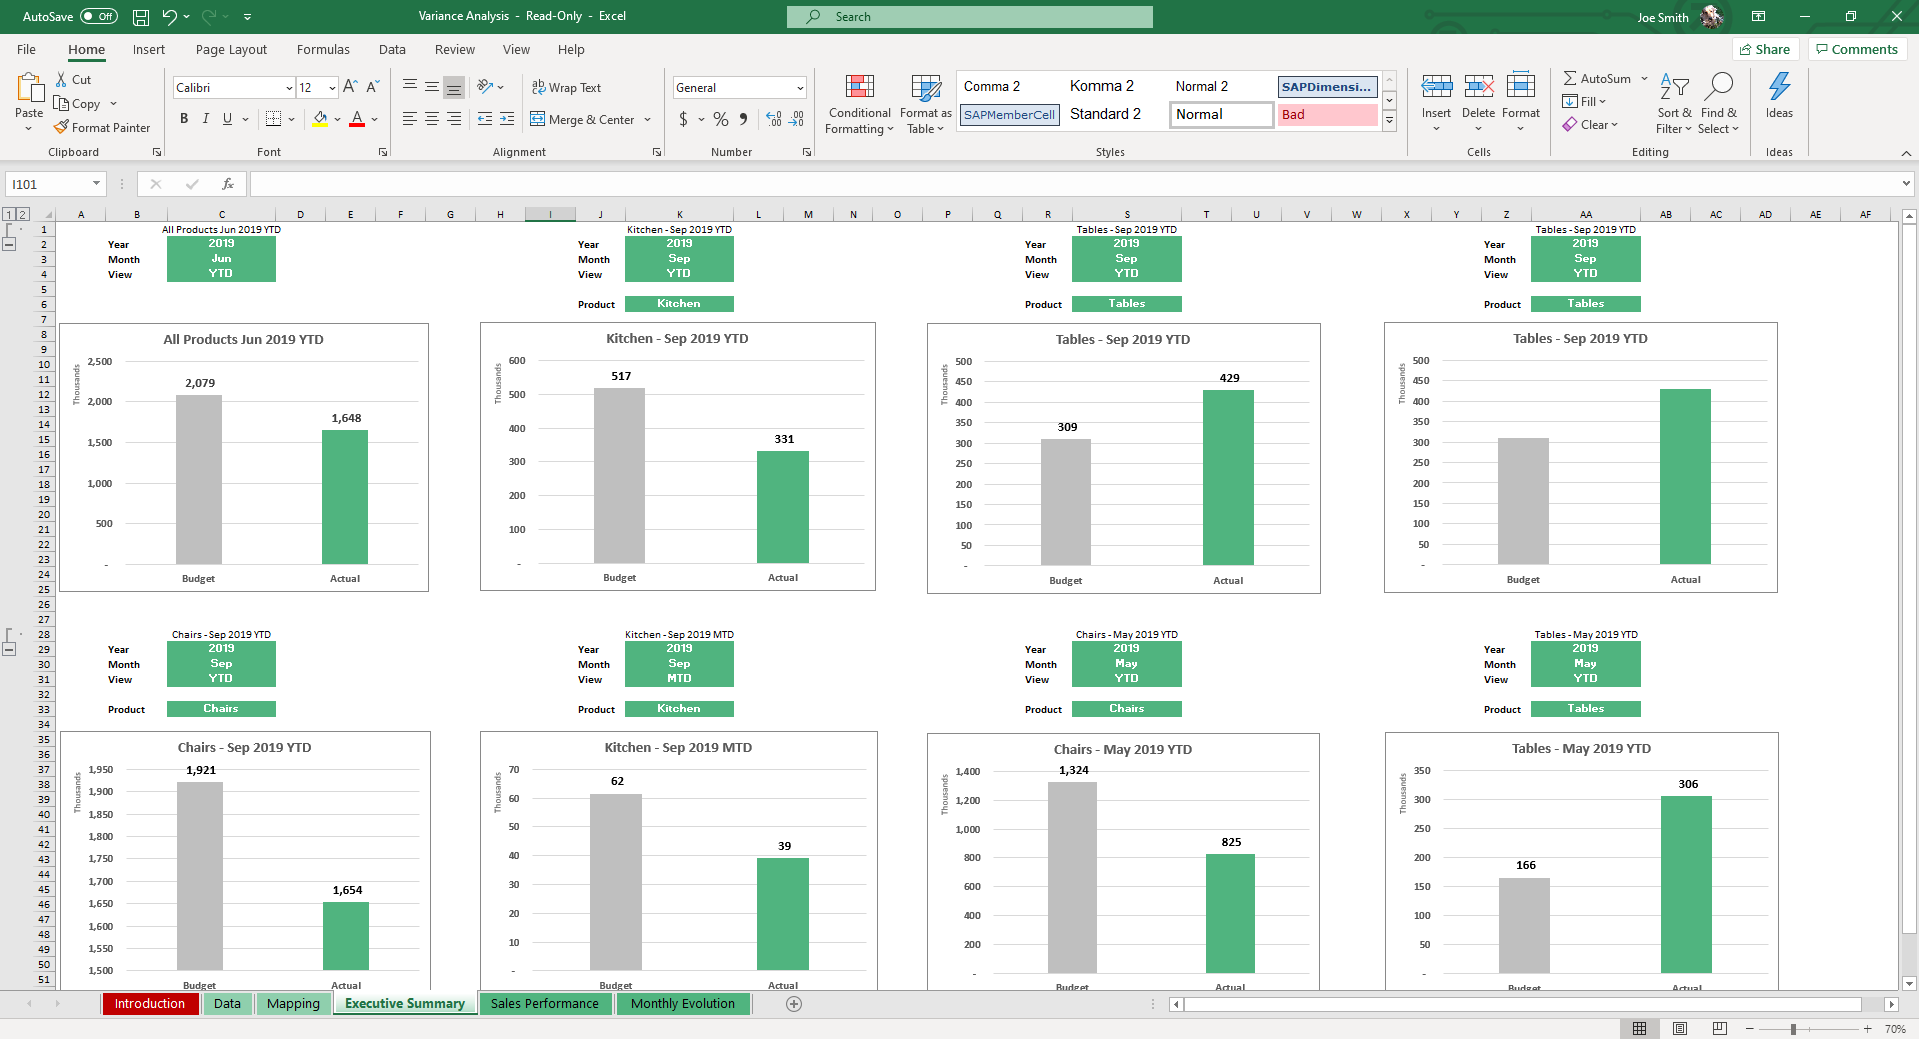
The Executive Summary sheet auto populates your data and turns it into bar graphs. Drop down menus make it easy to see the variance by month and year.
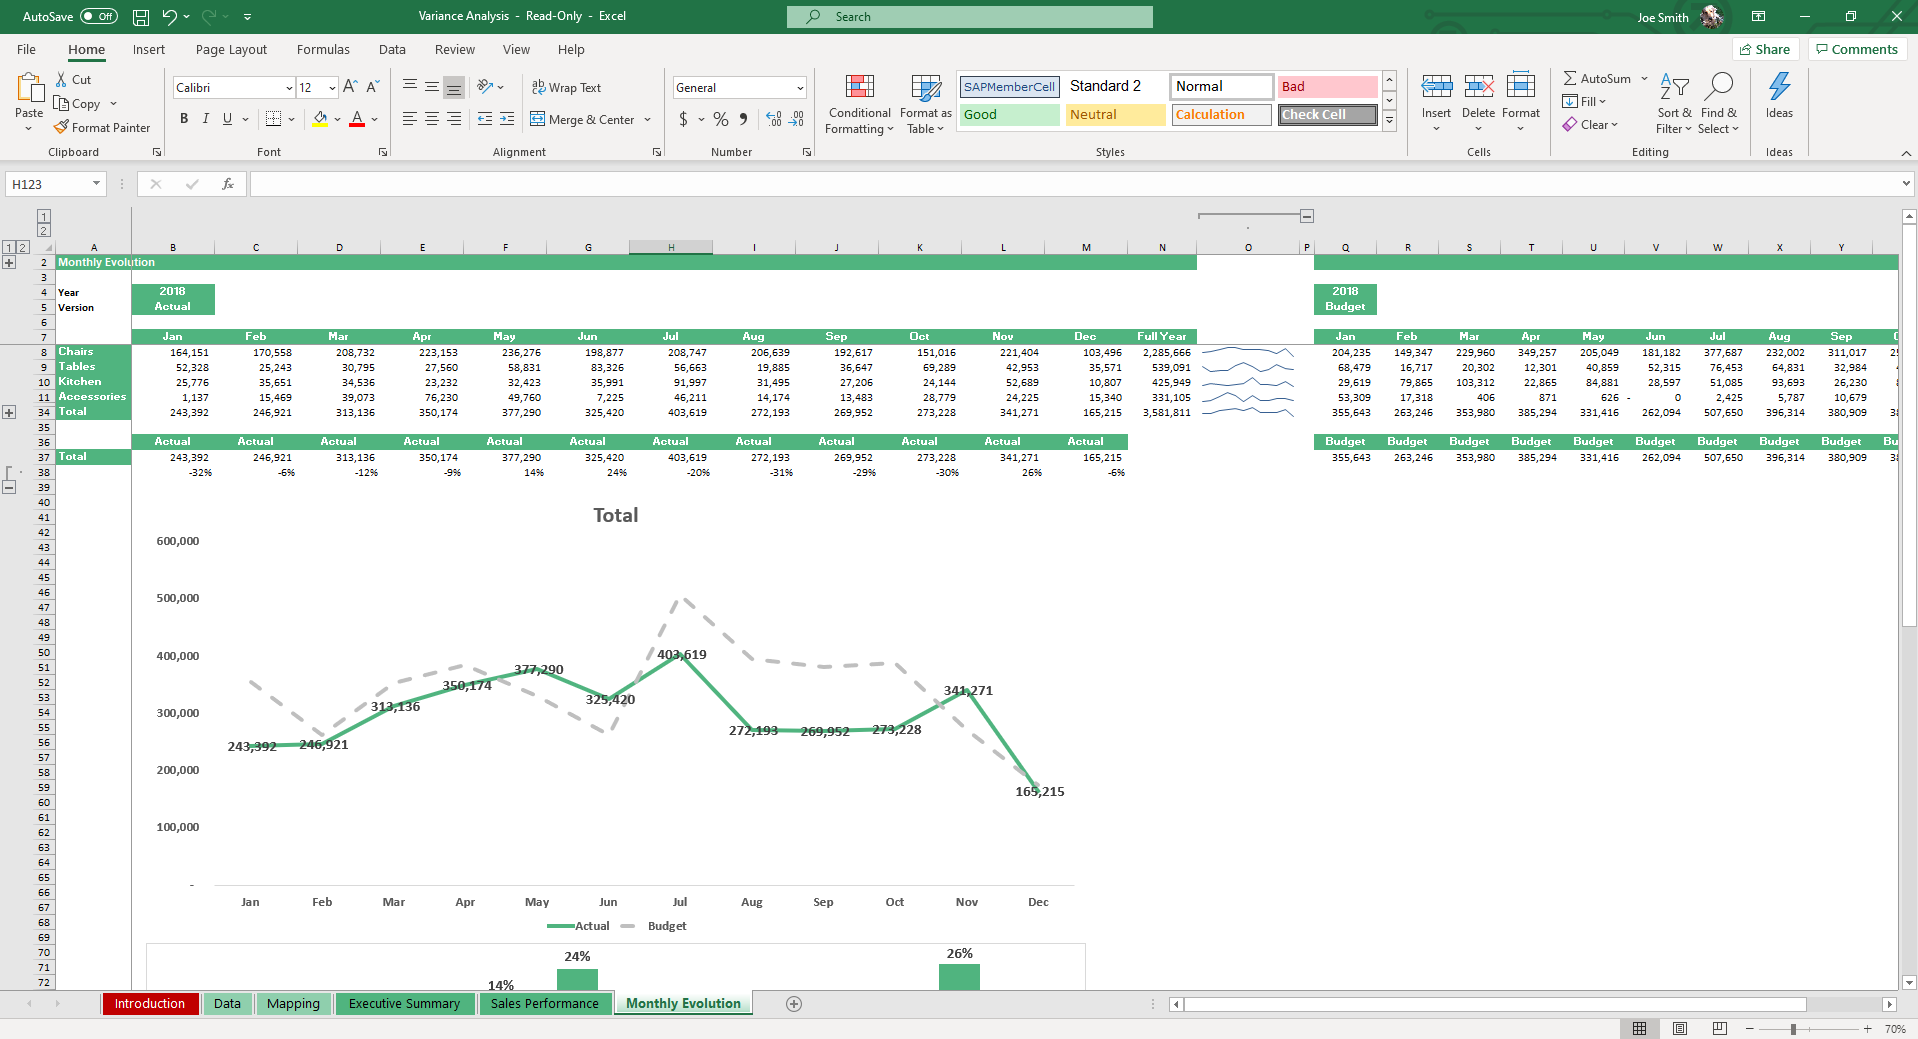
The Monthly Evolution sheet also plots 12-months of data into a chart so you can visually see the budgeted vs. actual points over the course of a year.
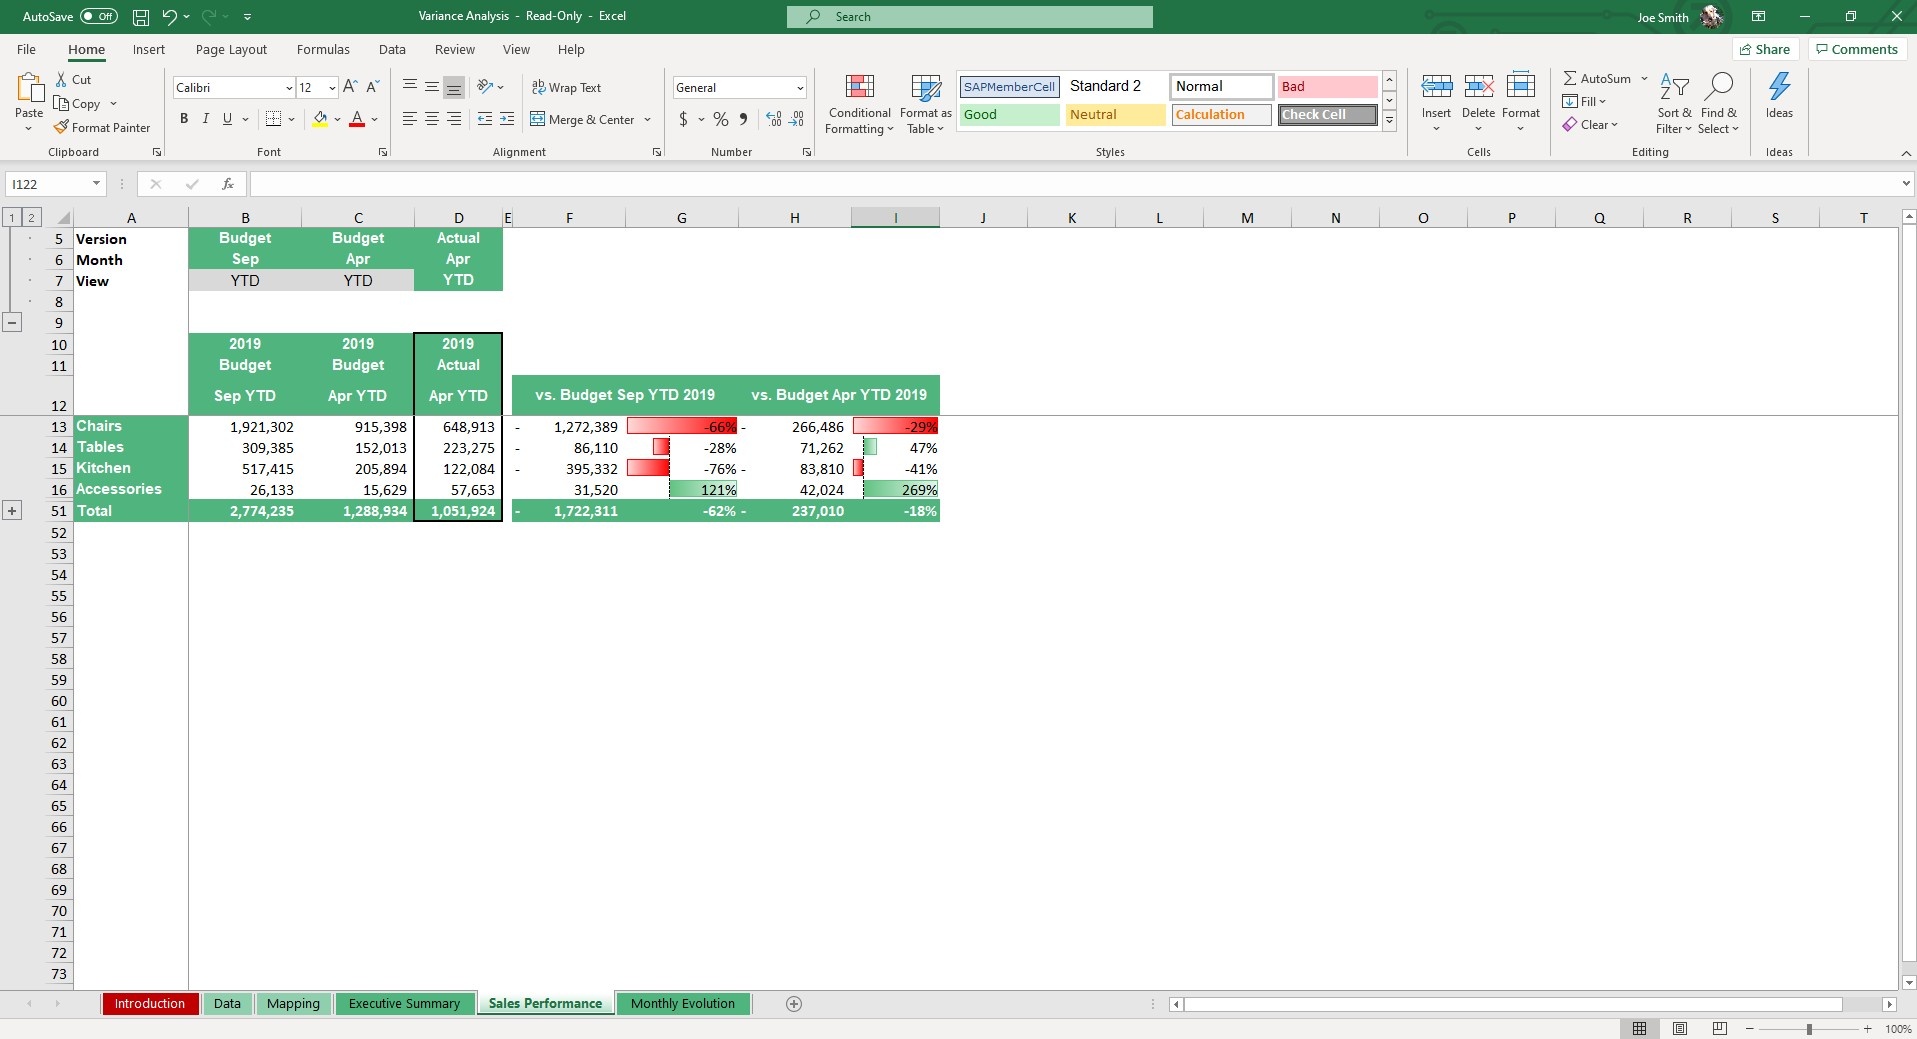
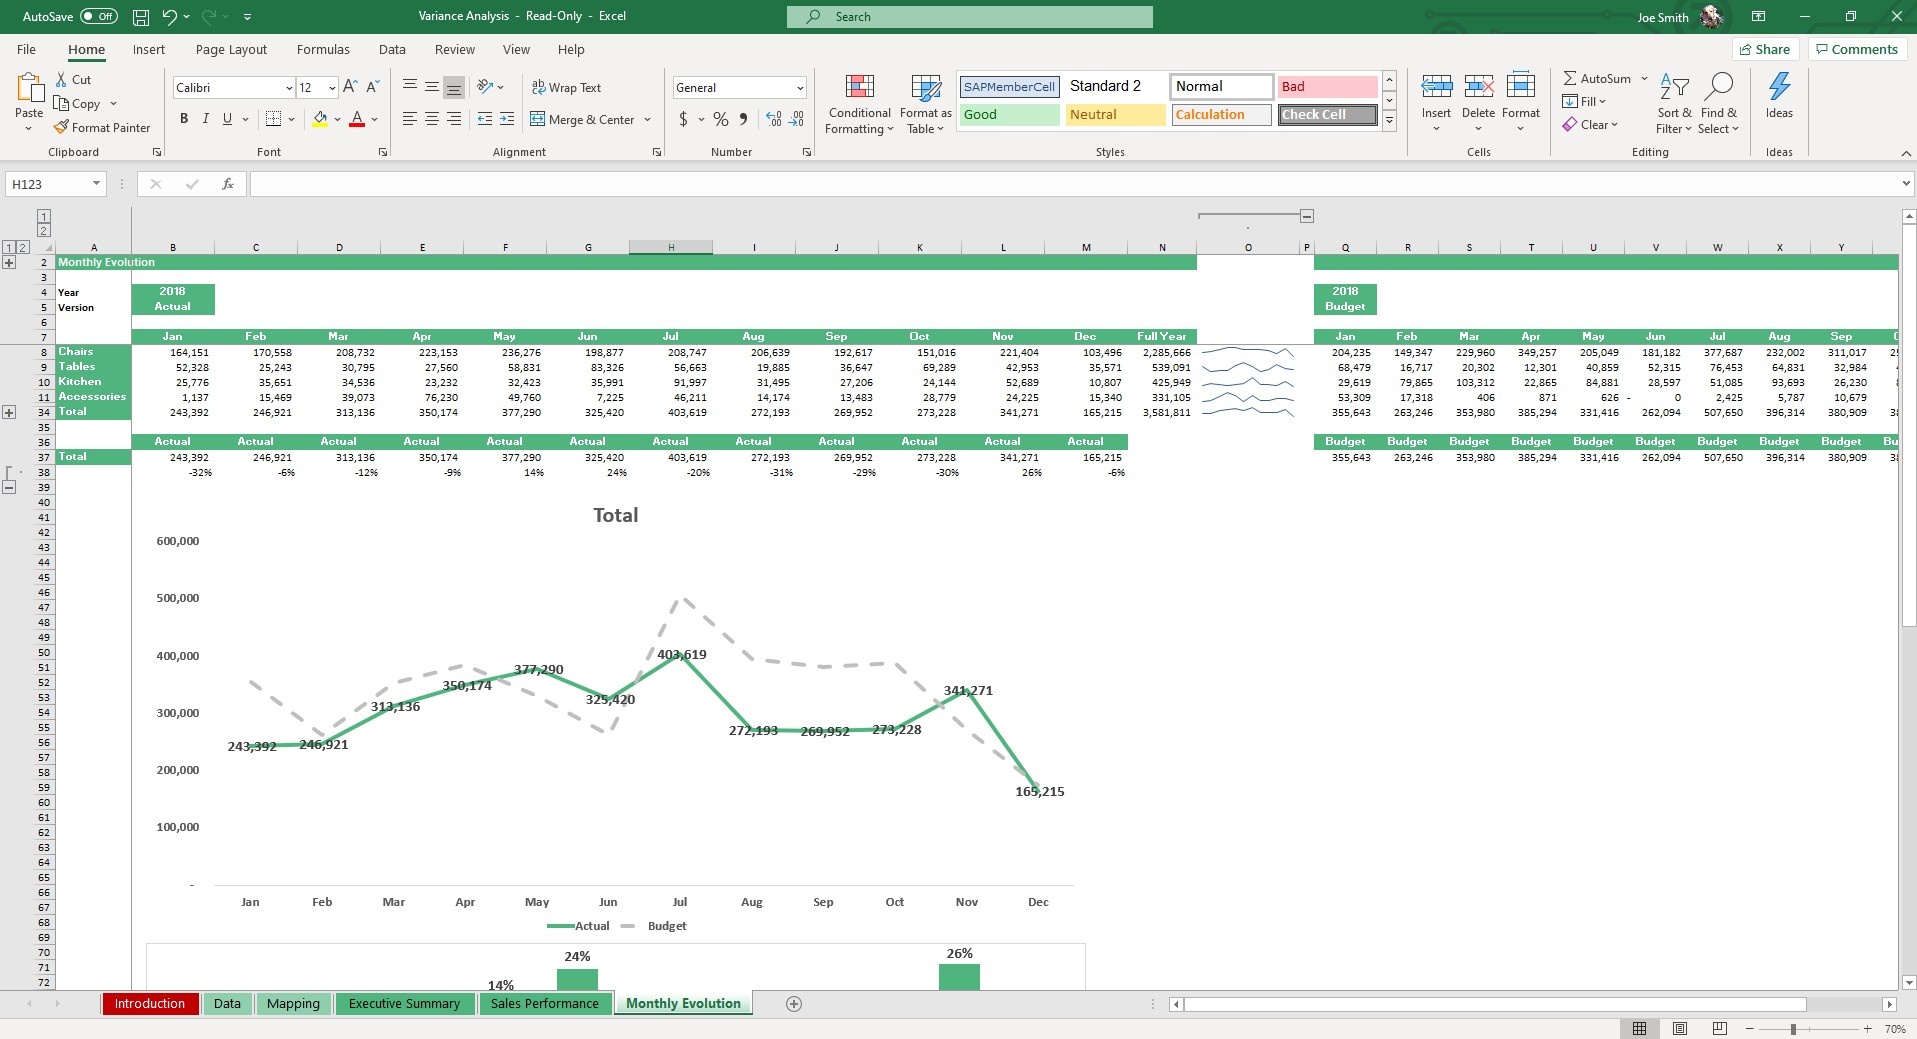
Below that chart is a graph that shows you the variance %, color-coded so the changes stand out visually.
As with all of our templates, the formulas and visuals are calculated so you don’t have to spin up any graphs on your own - unless you want to of course.
This template will allow you to better identify and share trends with your team. You can audit seasonality, product changes, growth, and more with our Variance Analysis Template.
If that wasn't enough reason to get this template, did you know this template is compatible with Google Sheets? Collaborate with your co-workers in real time and enjoy the cloud auto-save feature of Sheets when you use this template!
More Management Templates For You


