
KPI Management
Excel Template
What's Inside the KPI Management Template?
Details | 3 Sheets
Supported Versions | Excel 2010, 2013, 2016, 2019, Office 365 (Mac)
Category | Management, Strategy
Tags | OKR

Why Professionals Choose Simple Sheets
It's simple. Access to the largest library of premium Excel Templates, plus world-class training.

100+ Professional Excel Templates
Optimized for use with Excel. Solve Excel problems in minutes, not hours.

World-Class Excel University
With our university, you'll learn how we make templates & how to make your own.

How-To Videos
Each template comes with a guide to use it along with how-to videos that show how it works.
Inside Our KPI Management
Excel Template
There is no limit to the number of data points you can and should collect for your business.
However, treating every data point the same is a clear sign of a company with no compass, no direction. This is why KPI’s or Key Performance Indicators, are such an important business and life concept. Because you cannot focus on very many things at once. As Bruce Lee said, “Don't fear the man who knows 1,000 techniques. But fear the man that has practiced one technique 1,000 times.”
That’s the perfect introduction to our KPI Management Excel Template. This template gives an overview of various KPIs, what they mean, how they’re calculated and charts that help you visualize them.
Before we dive into this template, you’ll also love our Balanced Scorecard, Business Risk Analysis and Profitability Analysis templates. These templates are designed for strategists, managers, consultants and founders looking to hone in on the most important aspects of their business.
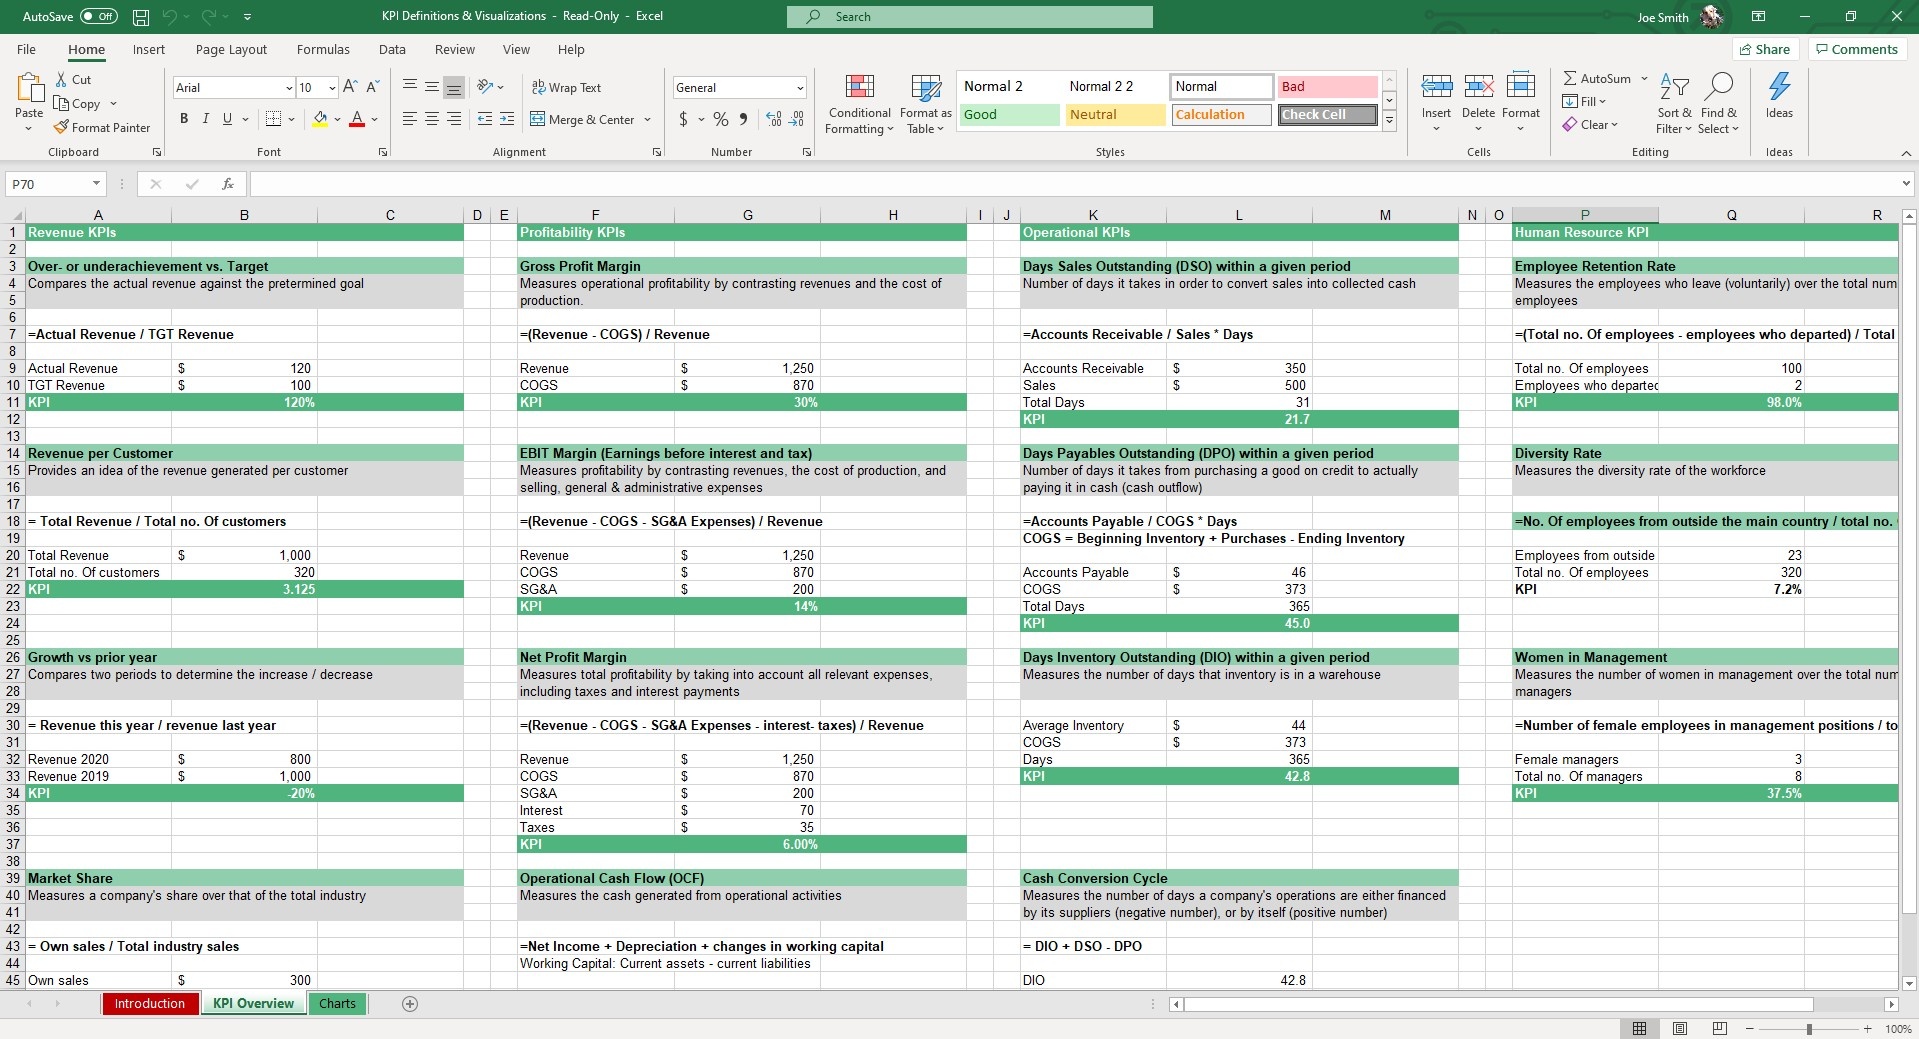
Start in the KPI Overview sheet. There are three headers titled Revenue KPIs, Profitability KPIS, Operational KPIs and Human Resources KPIs.
Input your data and the KPI will auto calculate for Revenue Per Customer, Growth vs. Prior Year, Market Share, Gross Profit Margin, EBIT Margin, Net Profit Margin, Operational Cash Flow, DSO within a given period, DPO, DIO, Employee Retention Rate, Diversity Rate, Woman in Management.
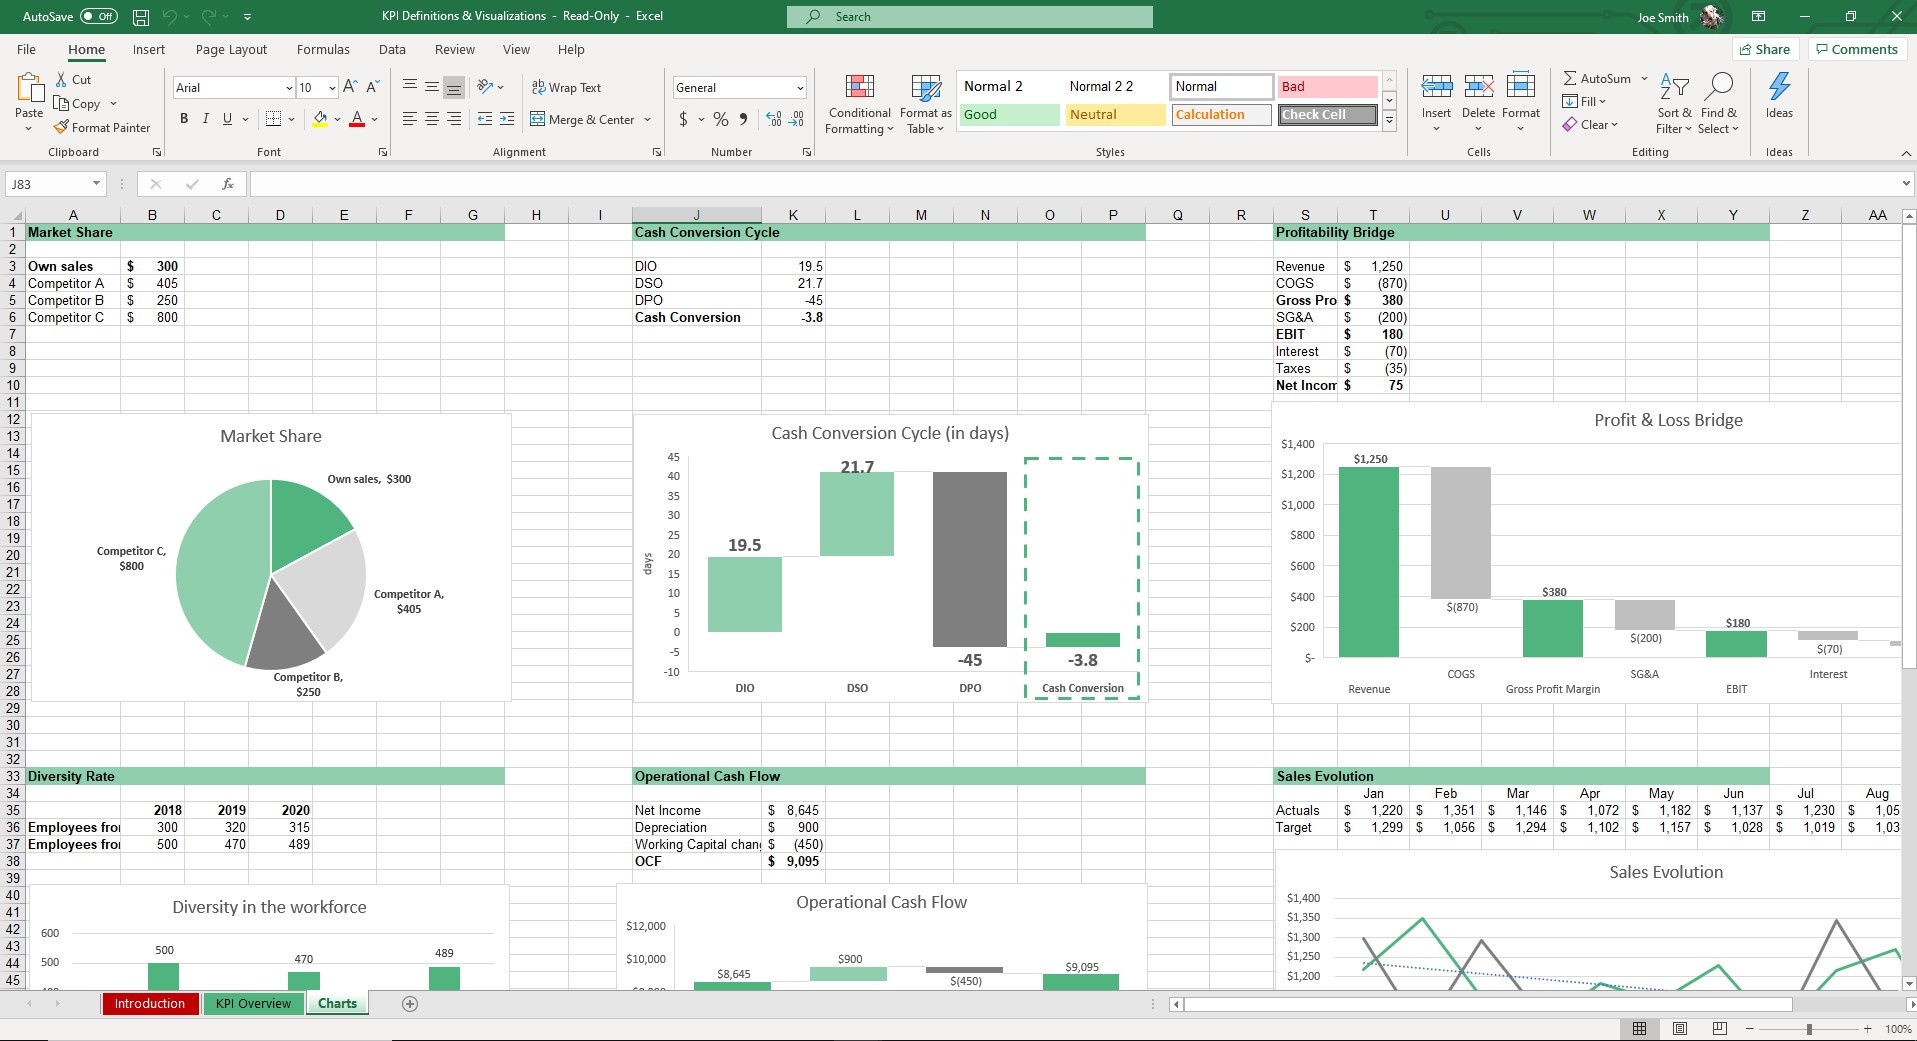
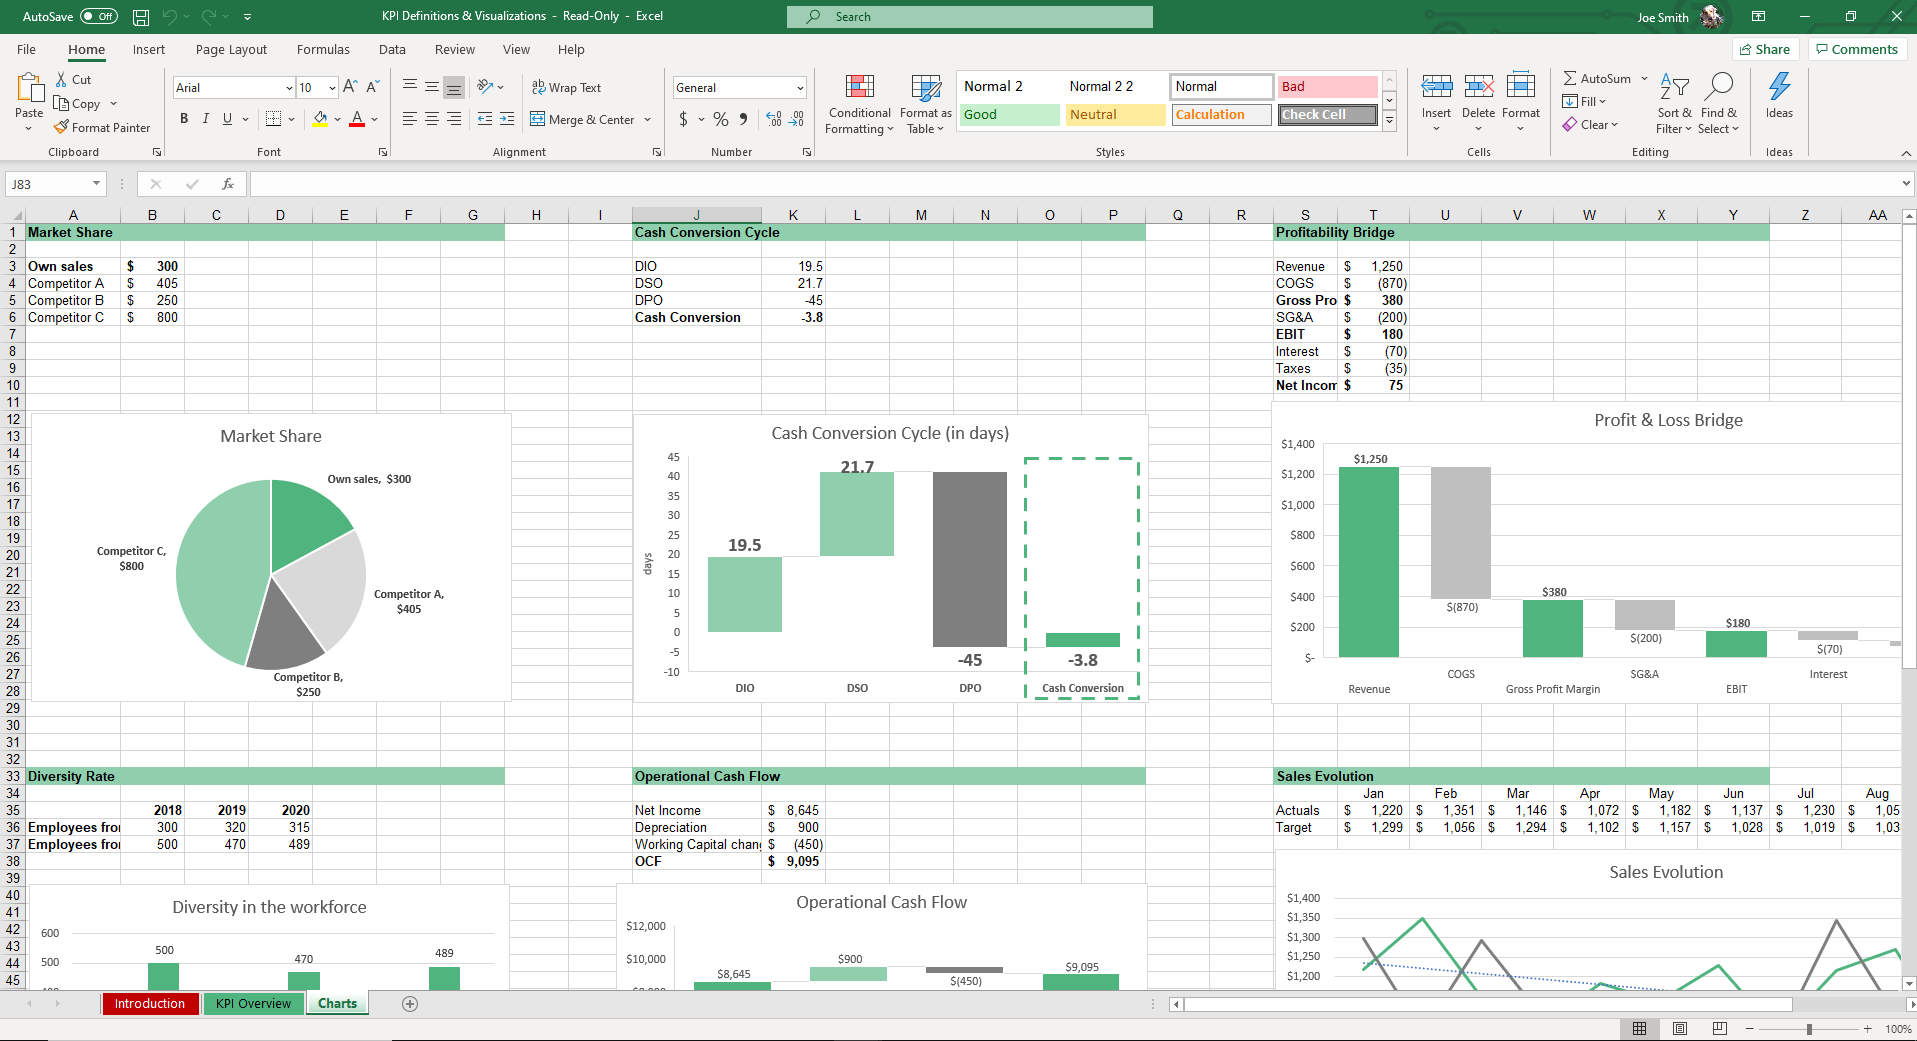
Hop over to the Charts sheet and you will see a number of charts and graphs tied to certain metrics. Edit the data with your inputs and the graphs and charts will reflect those numbers.
Our goal at Simple Sheets is to make your data actionable. We’ve found the best way to do that is with visuals that are digestible to everybody. Using this template, you can stay on top of the numbers that really matter and focus on growth.
More Management Templates For You


