Process Decision Program Chart (PDPC) Excel Template

What's Inside the Process Decision Program Chart Template?
Details | 4 Sheets
Supported Versions (All Features) | Excel 2019, Office 365 (Mac)
Supported Versions (Significant Features) | Excel 2016, 2019, Office 365 (Mac)
Category | Operations
Tags | Flow Chart, Management Planning Tool
Why Professionals Choose Simple Sheets
It's simple. Access to the largest library of premium Excel Templates, plus world-class training.

100+ Professional Excel Templates
Optimized for use with Excel. Solve Excel problems in minutes, not hours.

World-Class Excel University
With our university, you'll learn how we make templates & how to make your own.

How-To Videos
Each template comes with a guide to use it along with how-to videos that show how it works.
Inside Our Process Decision Program Chart (PDPC) Excel Template

It would seem that once you secure a relationship with a supplier and establish parameters, your work would be done. In reality, the work has just begun.
Supplier Relationship Management is a systematic assessment of suppliers’ assets and capabilities. Using our Supplier Relationship Management Excel Template, you can better manage your suppliers and create massive value for your company by understanding how each vendor contributes to the well-being (or detriment to the company).
If you find this template useful, you’ll also want to check out our Warehouse Management System, Product Quality Control and Contract Management templates. Similar to this template, the Contract Management Template helps you manage ongoing contracts and assign accountability to your partners.
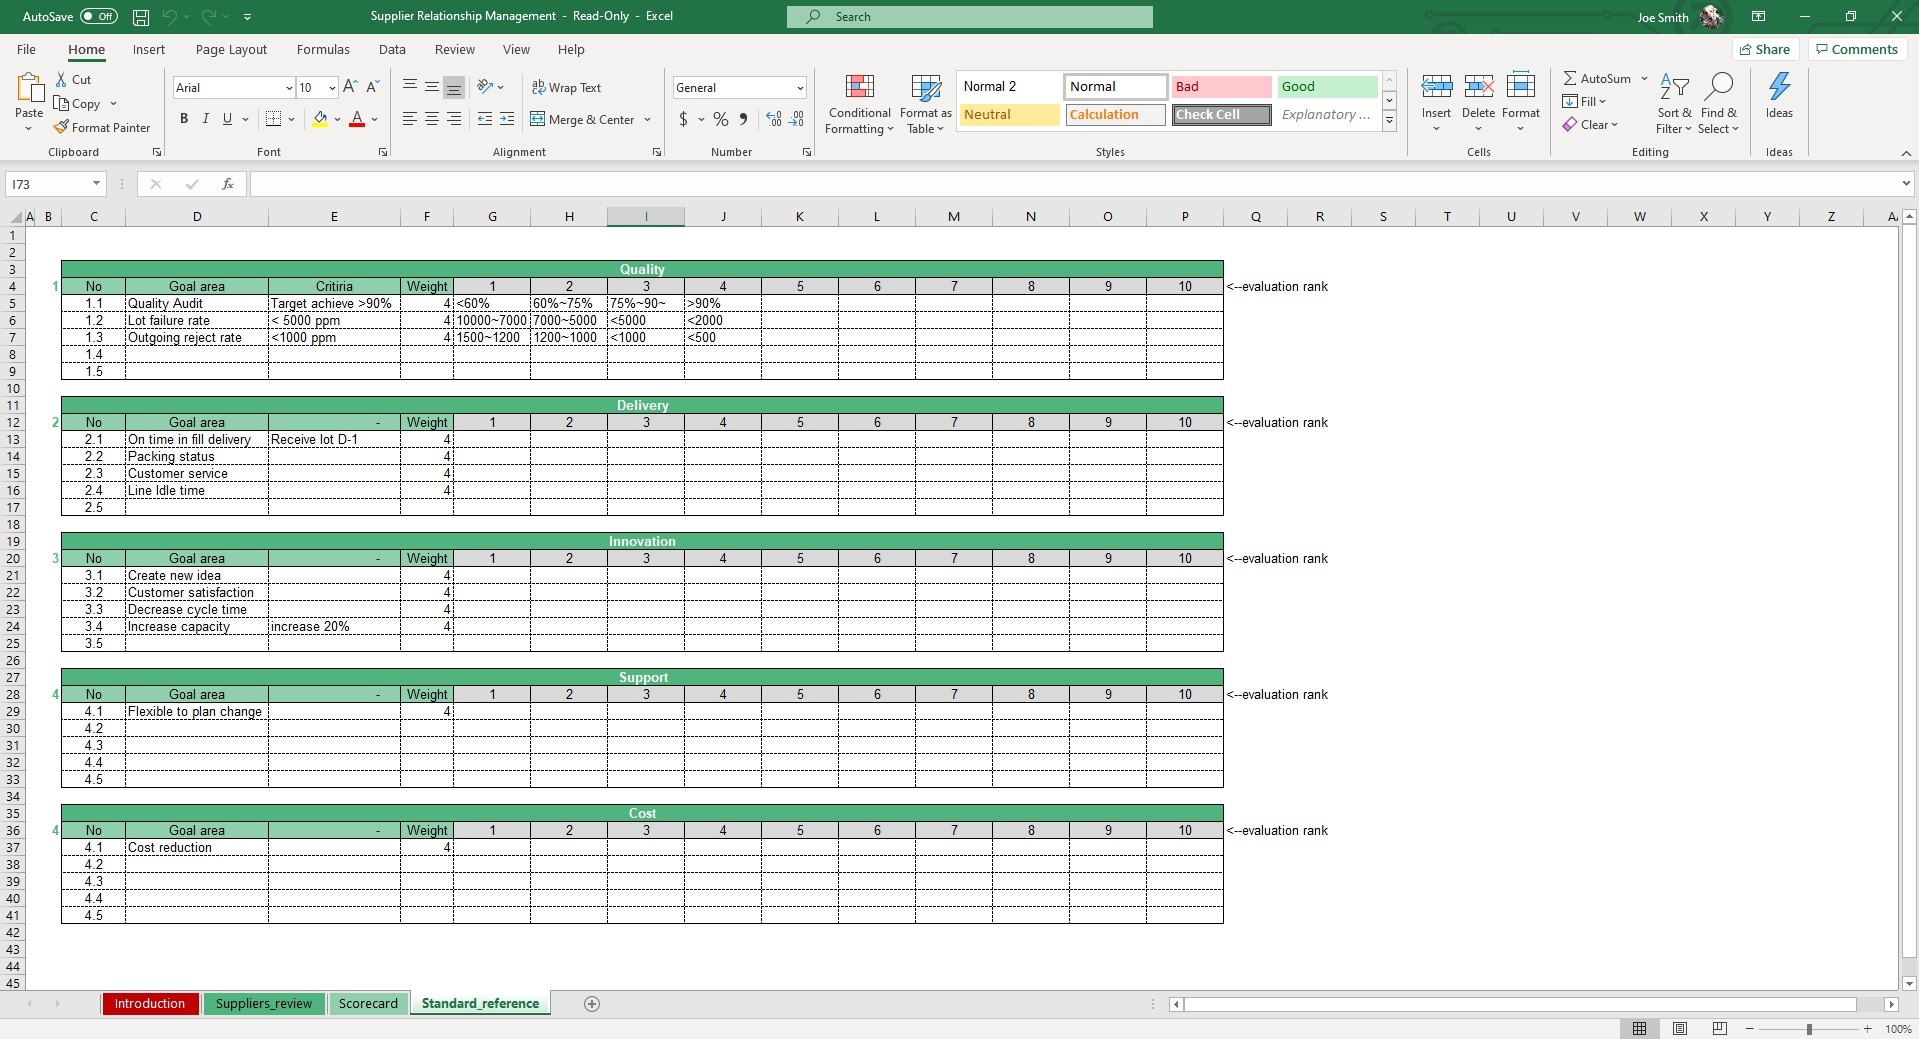
Start by adding company standards for each goal area in the Standard Reference sheet. Add weight for each goal area with the target criteria and milestone specifications.
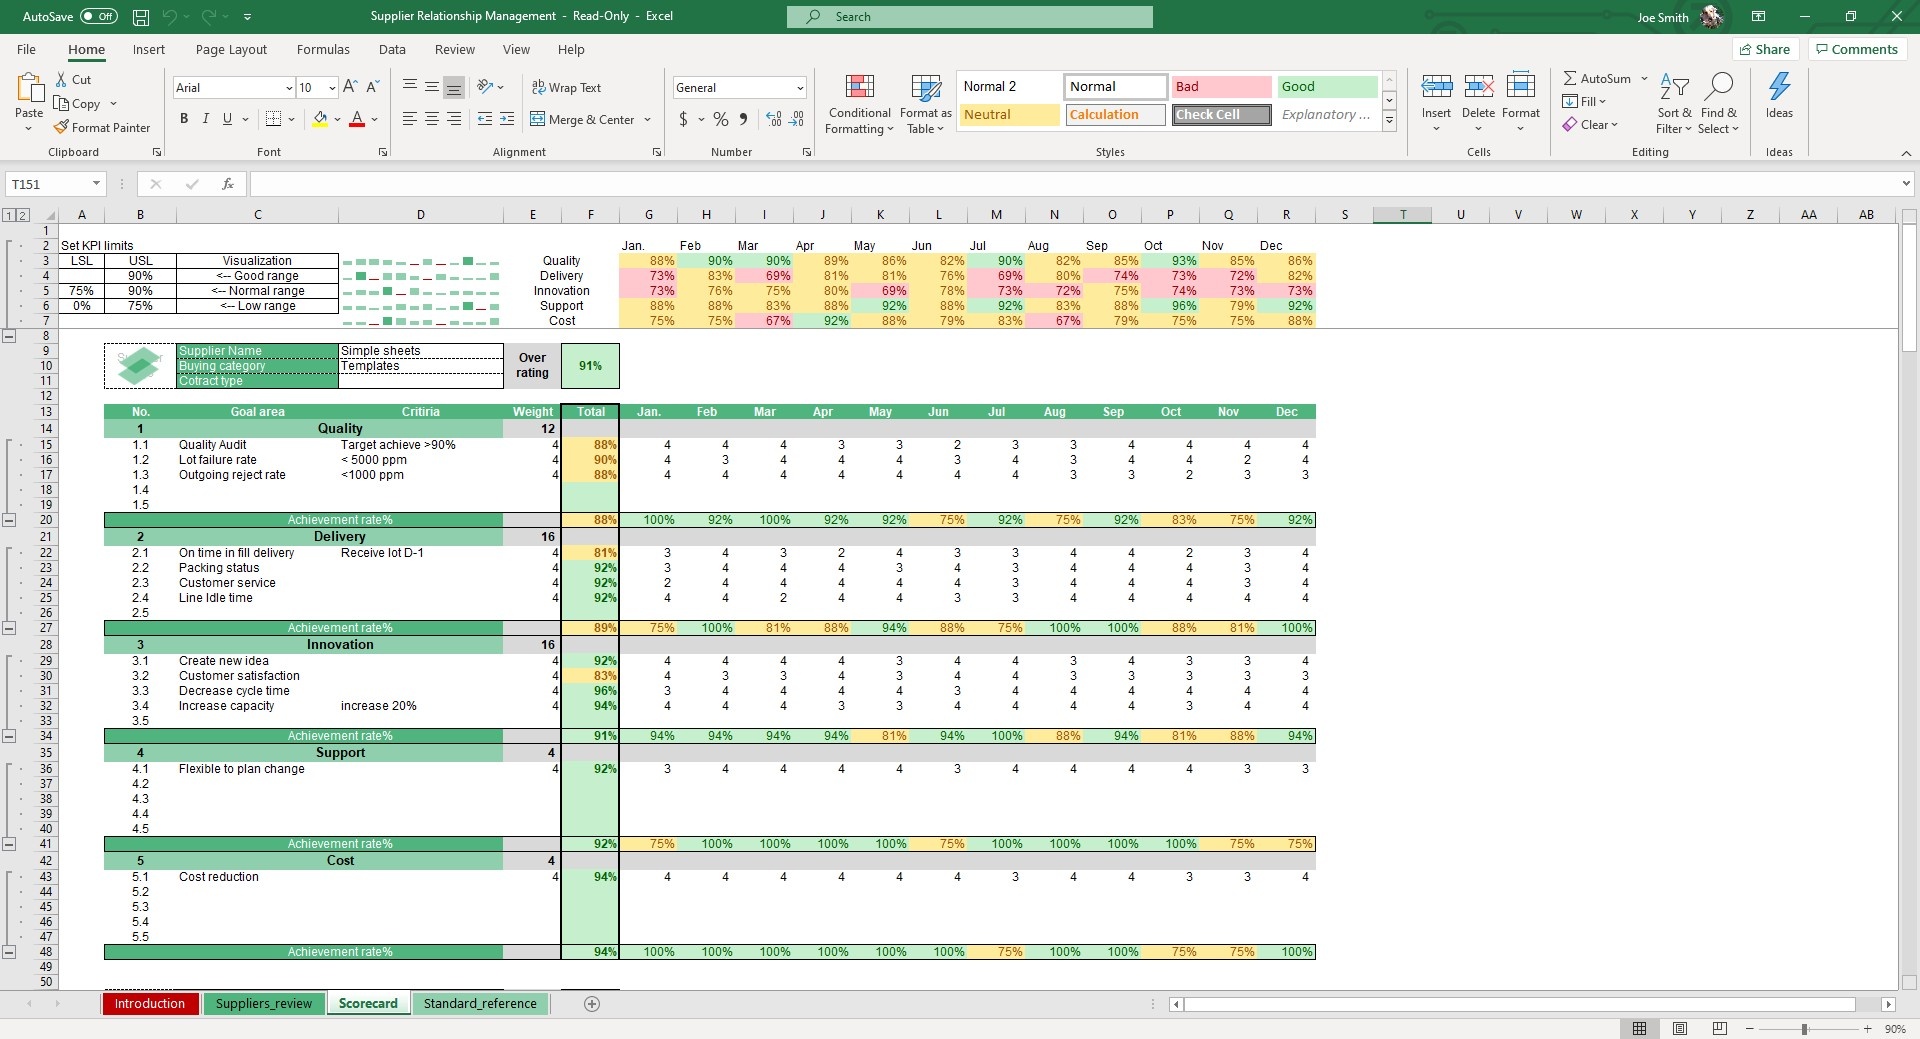
Move to the Scorecard sheet and add your suppliers. You can add up to 6 in this template. Inputs like Goal Area, Criteria, Weight and Total from the Standard Reference sheet will populate on this sheet.
At the top of the sheet is a table titled Set KPI Limits. You can change your visualization limits to your standards here.
You can add or collapse groups for the most simple data summary.


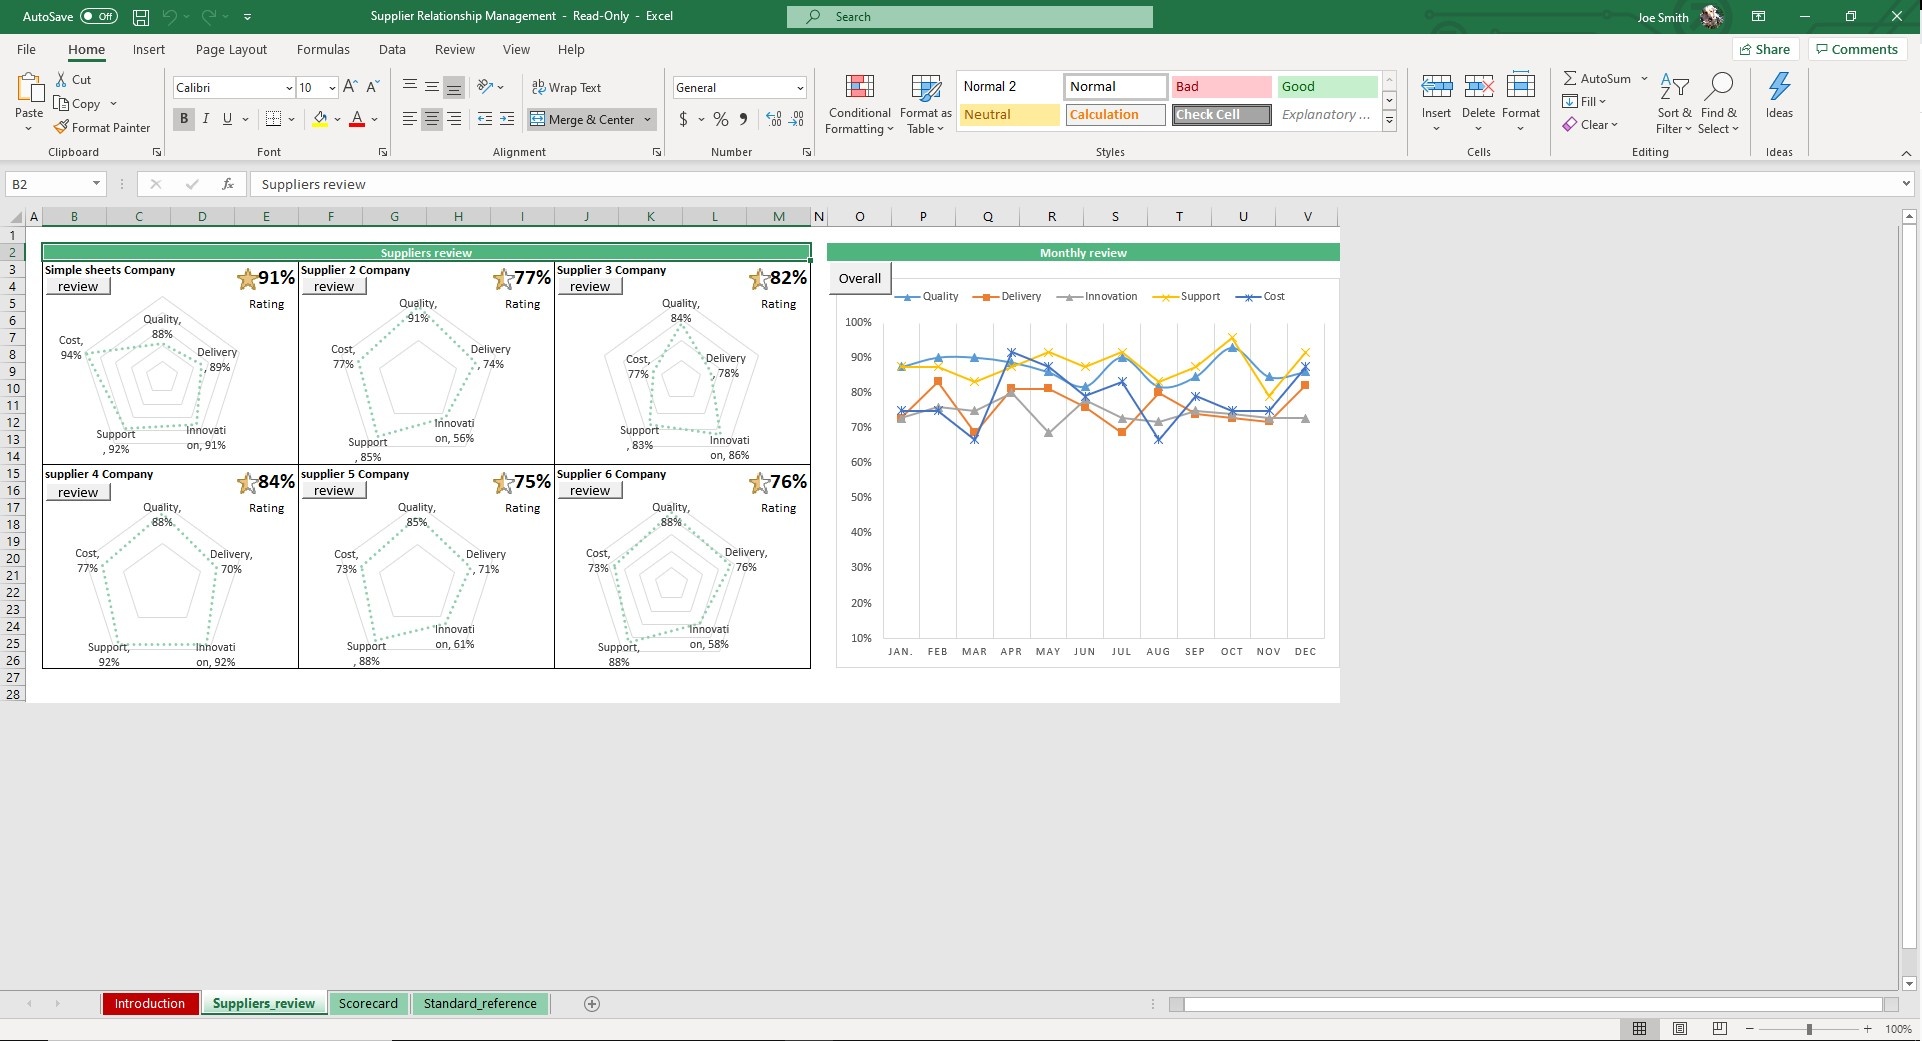
Last but not lease, navigate to the Suppliers Review tab. This sheet makes it easy to check each supplier's achievement compared with other suppliers. You can compare them by Cost, Quality, Delivery, Innovation, Support and a comprehensive rating based on all of those factors.
To the right side of the screen, you can also view a Monthly Review which can be manipulated by clicking the Review button. The chart will auto populate, allowing you to view and analyze the five points over a period of months.


