
Statistical
Process Control
Excel Template
What's Inside the Statistical Process Control Template?
Details | 2 Sheets
Supported Versions | Excel 2010, 2013, 2016, 2019, Office 365 (Mac)
Category | Supply Chains & Operations, Data Analysis
Tags | Six Sigma, Steam Stats, CPK, Control Techniques
Why Professionals Choose Simple Sheets
It's simple. Access to the largest library of premium Excel Templates, plus world-class training.

100+ Professional Excel Templates
Optimized for use with Excel. Solve Excel problems in minutes, not hours.

World-Class Excel University
With our university, you'll learn how we make templates & how to make your own.

How-To Videos
Each template comes with a guide to use it along with how-to videos that show how it works.
Inside Our Statistical Process Control
Excel Template
“You can’t manage, what you don’t measure.”
In other words, good luck improving anything without a baseline and goals. Perhaps no group of people are more oriented to measuring processes and points like those who work in operations, logistics or supply chain management.
One of the most popular methodologies to measuring quality and monitoring processes in manufacturing is Statistical Process Control. Our Statistical Process Control Excel Template is one of many templates in our library that enable managers to improve their processes.
If you find this template useful, you’ll also want to check out Excel templates for the Seven Quality Controls (7-QC) such as a Pareto Chart, Scatter DIagram and Stratification as well as the Seven Supplemental Tools (7-SUPP) like Data Stratification and Defect Maps. These tools are pre-built and designed for you to utilize right away without spending the precious time designing formulas and processes.
Let’s dive into how to use our Statistical Process Control Template.
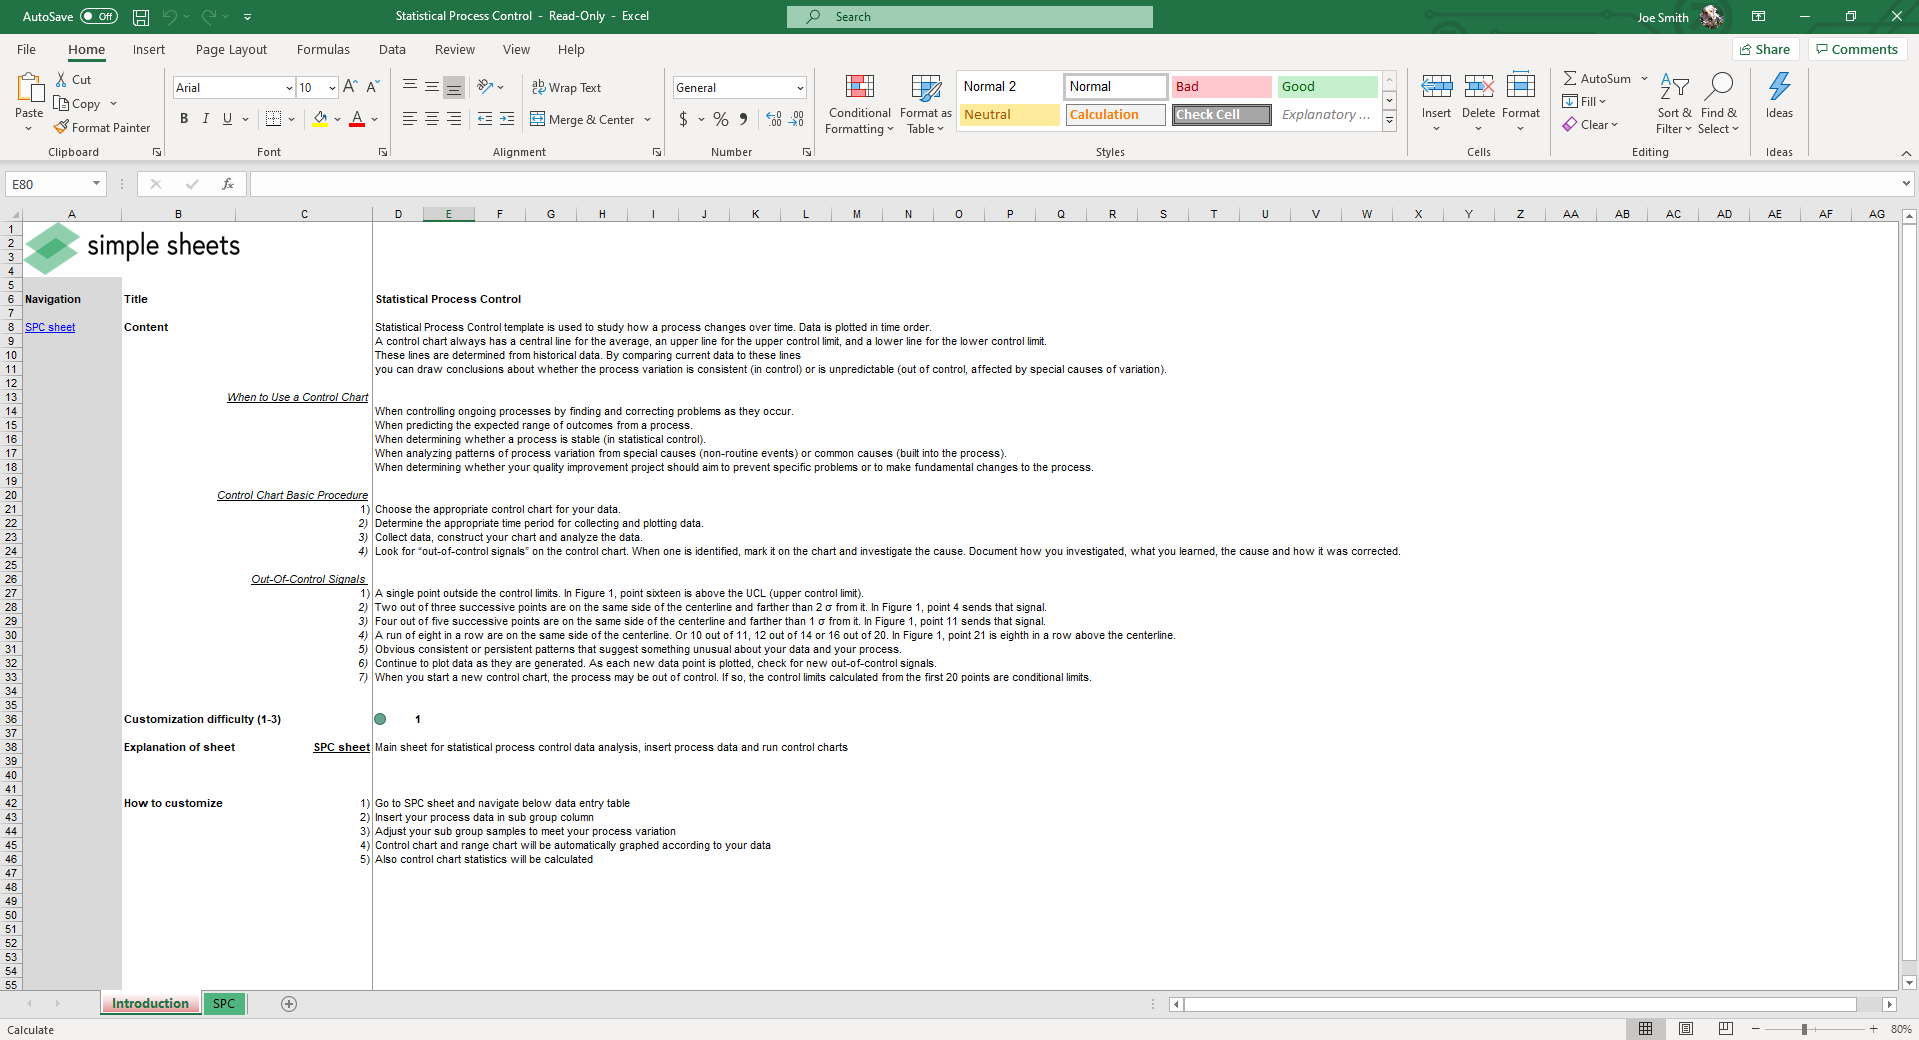
In the SPC sheet, insert process data in the sub group column. Then adjust your sub group samples to meet your process variation.
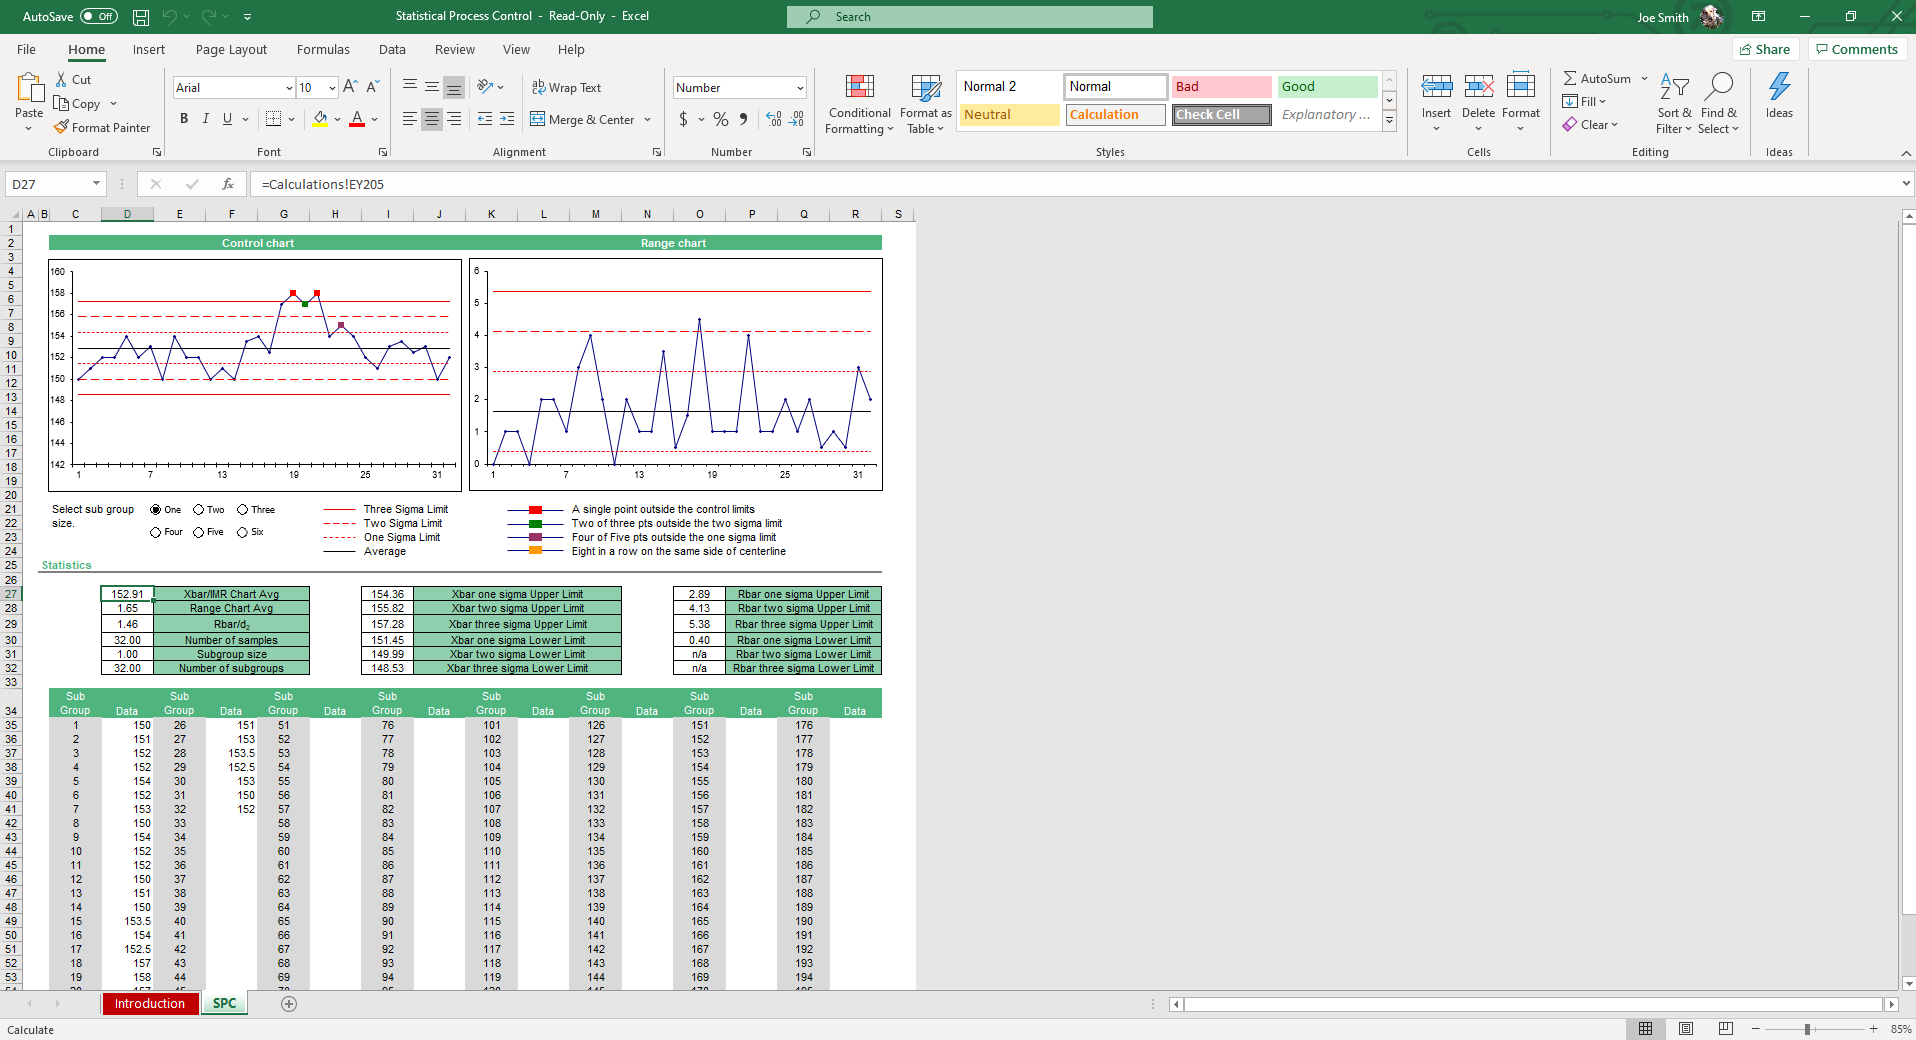
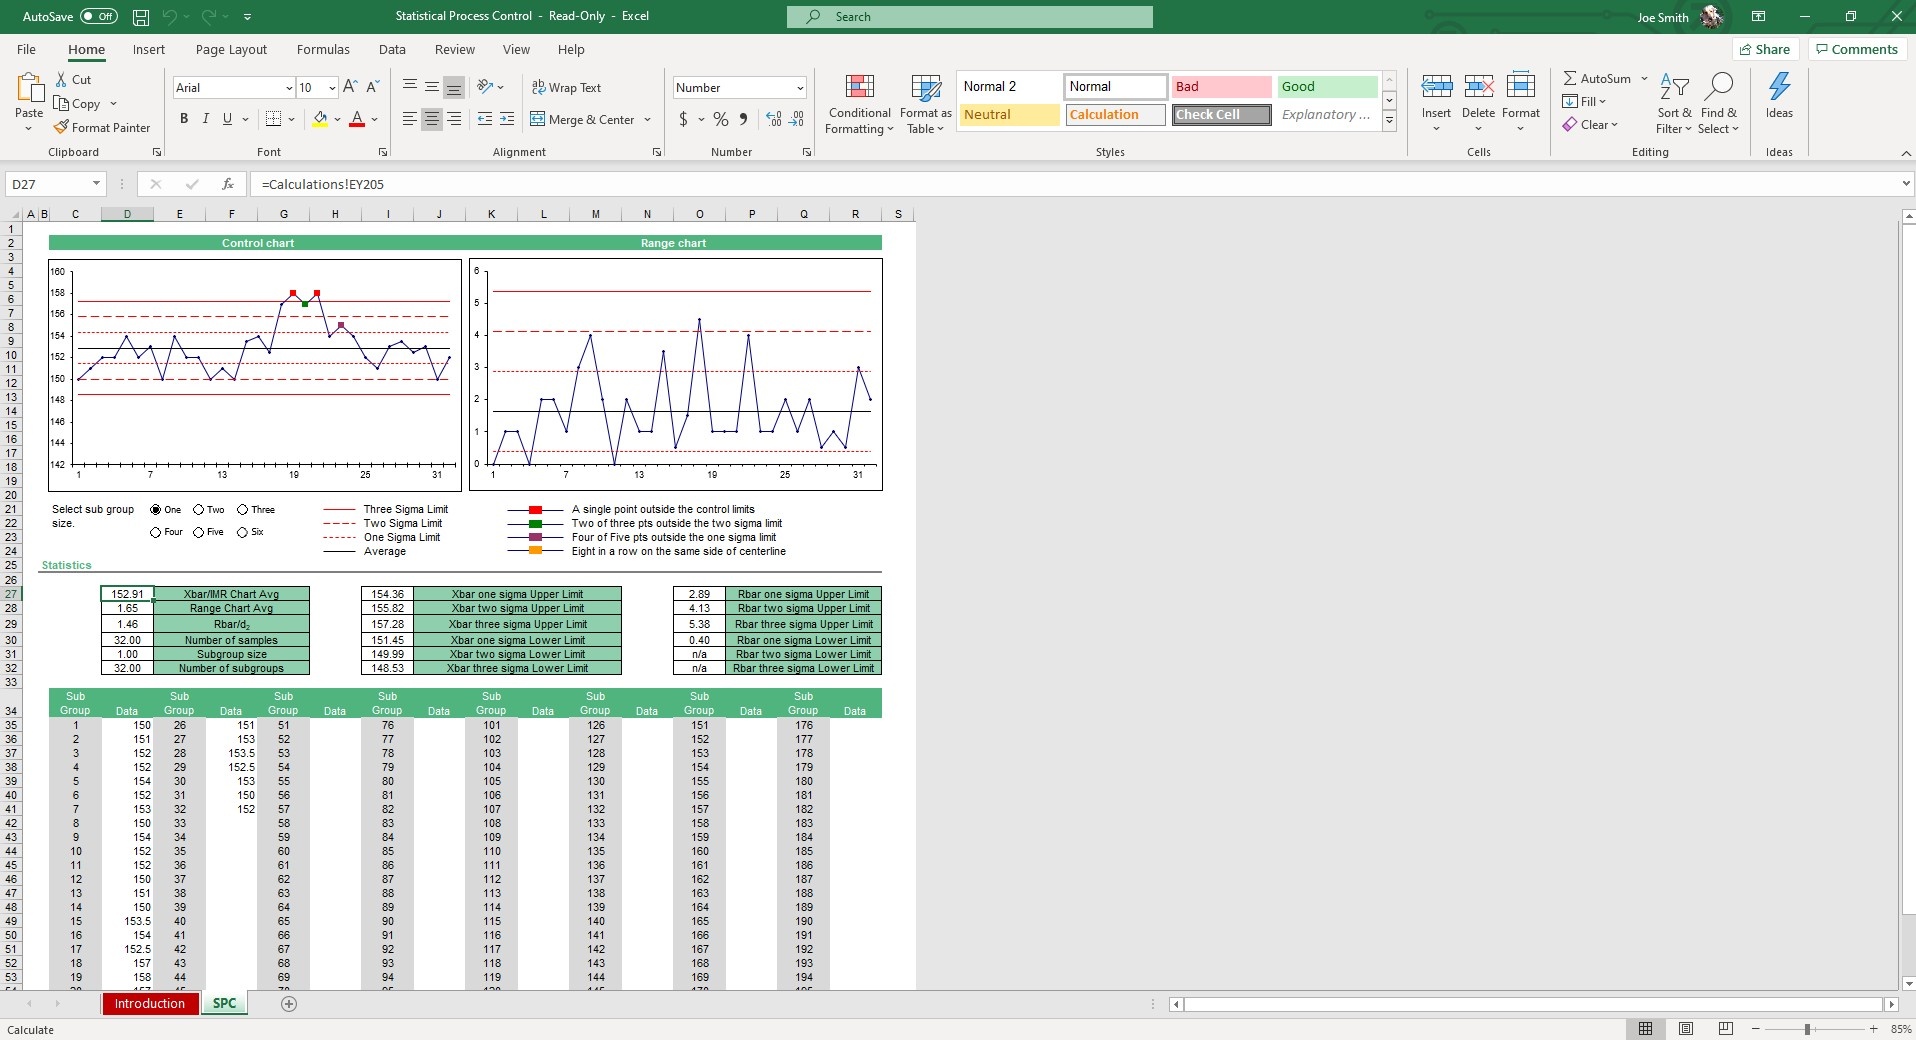
Select the Sub Group Size (One through Six) and The Control Chart and Range Chart will be automatically calculated and graph the Three Sigma Limit, Two Sigma Limit, One Sigma Limit and Average. Points outside the control limits will be highlighted on the graph and are color-coded.
The three tables below the graphs will also auto populate with data like Xbar/IMR Chart Avg, Range Chart Avg, Number of Samples, Subgroup Size and Number of Subgroups.
This template makes it simple to identify process variations, the predictability of processes and out of control signals.
Whether you are in healthcare, the food industry or manufacturing, this spreadsheet follows a proven methodology sure to help you manage and measure your processes better.
More Data Analysis Templates For You


