
Pivot Table Google Sheets Walkthrough [Redirect]
May 24, 2022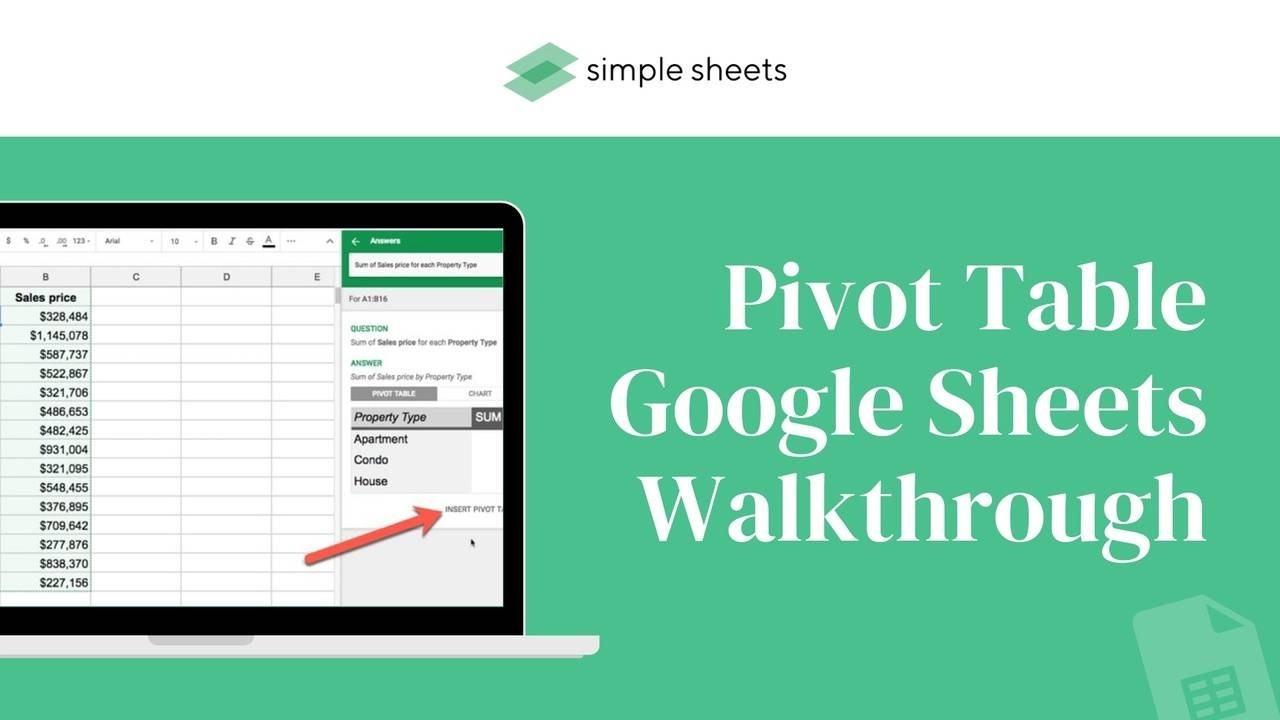
With vast amounts of data, it can sometimes be hard to establish clear answers or gather conclusions if you use a simple spreadsheet table in google sheets.
But that will all change once you learn how to create a pivot table in google sheets. Pivot tables in Google Sheets make all the difference when analyzing data effectively and efficiently. They are highly flexible, much faster, and easier to use than basic spreadsheet formulas. This article will explain in much greater detail pivot tables in Google Sheets, their benefits, and how to create your own.
Get our free Excel formulas cheat sheet
Plus new tutorials and template drops. Enter your email and we'll send it over.
What are Pivot Tables, and do Google Sheets have them?
Simply put, a pivot table in Google Sheets summarizes data selections. These data selections need already be in your Google Sheet, serving as the source data for your pivot table. A pivot table editor can clearly view your business's revenue from a specific product, service, store, or period. The pivot table editor gives you complete control over what your pivot table looks like. Pivot tables comprise pages, data fields, rows, and columns that can be moved, edited, and tweaked. This freedom lets you expand, group, sum, or isolate your data fields in real-time. Pivot tables allow you to view summarized data, offering you a view of specific data sets and allowing you to organize essential information more clearly. 
The Benefits of Pivot Tables
A Google Sheets pivot table is quick and easy to use.
A Google Sheets pivot table is straightforward to understand and doesn't need a lot of effort. Google Sheets pivot tables can be created in just a few clicks. So long as you possess a raw data set with your Google Sheets spreadsheet already, you can manually create a pivot table. Using a Google Sheets pivot table allows you to not worry about utilizing formulas or taking time extracting data manually. A Google Sheets pivot table saves you plenty of time and effort and lets you quickly extract the same data and then focus on other aspects of your project.
Create data instantly.
A Google Sheets pivot table allows you to instantly create data, regardless of whether you implement spreadsheet formulas or other methods. A pivot table allows you to compare plenty of data in seconds and use that data set to gather the information you need with minimal effort.
Generate accurate reports faster.
The traditional format of generating a report via spreadsheets can be highly timely and energy-consuming, so using a pivot table in Google Sheets can be much more efficient. Pivot tables in Google Sheets allow you to develop various reports with the same original data file without copying and pasting information into new sheets. Using pivot tables in Google Sheets is also a great way to eradicate the chance of human error in the underlying data and result in more accurate reports.
Summarize vast data sets with ease.
Using pivot tables in Google Sheets makes it much easier to summarize vast quantities of data in just a few clicks. Pivot tables can aggregate data into transparent, straightforward formats without wasting time adding spreadsheet formulas. Pivot tables make it simple to organize, sort, and label rows and columns how you want to see them, rather than getting forced to decipher data presented in a way you don't like. This means a pivot table makes it much easier to digest and segment data to be analyzed.
Quicken the decision-making process.
Business leaders and organization managers must make important decisions quickly or risk falling behind in the market and not hitting client demands. Pivot tables are a fantastic way to streamline that decision-making process, as they save time and effort in gathering essential insights for crucial decisions.
Understand data patterns.
Forecasting is one of the most critical aspects of almost any business or organization, but only when done correctly with the right underlying data. You must have the right source data to understand patterns and make reliable estimations to help your business reach new heights. Pivot tables allow you to identify data patterns through fully customizable tables that help break down large data sets. Pivot tables let you manipulate source data to unearth patterns and trends quickly and easily for better forecasting.
How to Make a Pivot Table in Google Sheets
Open your data set.
Start by opening your Excel spreadsheet or Google Sheets file containing the needed raw data, and click anywhere within the table.
Go to Menu and find Data.
Head to the Google Sheets Menu, click Data and select Pivot Table. Choose whether you want to insert a pivot table in a new or existing sheet. If you create a new sheet, the name will be Pivot Table 1, 2, and so on as you add more.
Add your row and value data.
Choose Rows from the Pivot Table Editor in Google Sheets and input your data. From there, click on Values, Add, and your chosen location. There you have it! Your first pivot table in Google Sheets. You can add pivot tables or tinker with your existing ones from there. Let's dive deeper into the essential functions and components to grasp Google Sheet pivot tables better. 
Rows.
Select Add from the Rows section within your Pivot Table Editor, and you'll notice a list of the pivot table's column headers will appear. Please choose one of them, and your Google Sheets pivot table will show the unique data set in your chosen column.
Columns.
When you input Columns, you will notice that the Values section shows aggregated information for each column. The fields from the Columns section will show as a unique list, which you can see in the top box of your Google Sheets pivot table.
Values.
Select Values to view the same column headings list; choosing one will make your pivot table summarize your desired column. Don't forget to manually refresh pivot tables to make sure they have the most up-to-date in them. Fields within the Values category are shown within the middle box of the pivot table as numbers. For example, you could want to average or sum up your company's revenue, or if you have a column comprising text values, you might decide to count them.
Totals.
You can disable or enable totals for your Values data columns with a pivot table in Google Sheets. To turn totals on or off, select the box next to the Show Totals option below the Rows and Columns category inside the Pivot Table Editor.
Google Sheets can build Pivot Tables.
If you think it sounds simple to make your pivot table in Google Sheets, it can be even more accessible and quicker to make a pivot table in Google Sheets with Google's artificial intelligence! You follow the same steps to create a Google Sheets pivot table to utilize this option. Rather than inputting your values and data, Google generates a pre-built pivot table based on suggestions via the Pivot Table Editor window. Creating pivot tables in Google Sheets with a suggested pivot table can be done in just a few clicks. It's a fantastic feature for building data on a new or existing sheet. Another way to create a pivot table automatically with all the data you need is by using the Google Sheets Explore tool. Select the star-shaped icon at the bottom right of your Google Sheet, and you will notice the Explore window pop up with various pivot table suggestions about your data. You can take these suggestions or keep your original data as it is in your pivot table sheet. If you want a Google Sheets Explore tool suggestion, click on it to update your current pivot table automatically.
Google Sheets Pivot Table: Summary and Key Takeaways
Now you know everything you need to try and create a pivot table in Google Sheets! Whether it is sales data, marketing statistics, or just a set of practice data, be sure to work on the skills highlighted in this article. And remember: A Google Sheets pivot table is quick and easy to use: A Google Sheets pivot table is straightforward to understand and doesn't need much effort. Create data instantly with a pivot table: A Google Sheets pivot table allows you to instantly create data, regardless of whether you implement spreadsheet formulas or other methods. Generate accurate reports faster with a pivot table: The traditional format of generating a report via spreadsheets can be extremely time and energy-consuming, so using a pivot table in Google Sheets can be much more efficient. Summarize vast data sets easily using a pivot table: Using pivot tables in Google Sheets makes it much easier to summarize vast quantities of data in just a few clicks. Using a pivot table will quicken the decision-making process: Business leaders and organization managers must make important decisions quickly or risk falling behind in the market and not hitting client demands. Pivot tables will help you understand data patterns: Forecasting is one of the most critical aspects of almost any business or organization, but only when done correctly with the right underlying data.
Frequently Asked Questions For "Pivot Table Google Sheets"
How do I create a pivot table in Google Sheets?
Follow the simple steps highlighted in this article to create a pivot table in Google Sheets. Before you know it, you'll find yourself moving on from your initial pivot table, copying it, testing new data points, and other advanced options.
What are pivot tables used for?
Pivot tables in Google Sheets are a fantastic way to understand what a data range shows you and quickly break down any large data table into digestible chunks. You can add multiple value fields, different row headings, or multiple row fields. Pivot tables offer all the unique combinations you can imagine for full customization. 
Related Articles:
A Reference Isn't Valid Excel Error | How to Fix this Error? How to Add Leading Zeros in Microsoft Excel How to Change Currency in Google Sheets
Want to Make Excel Work for You? Try out 5 Amazing Excel Templates & 5 Unique Lessons
We hate SPAM. We will never sell your information, for any reason.

