
Profitability Analysis
Excel and Google Sheets Template
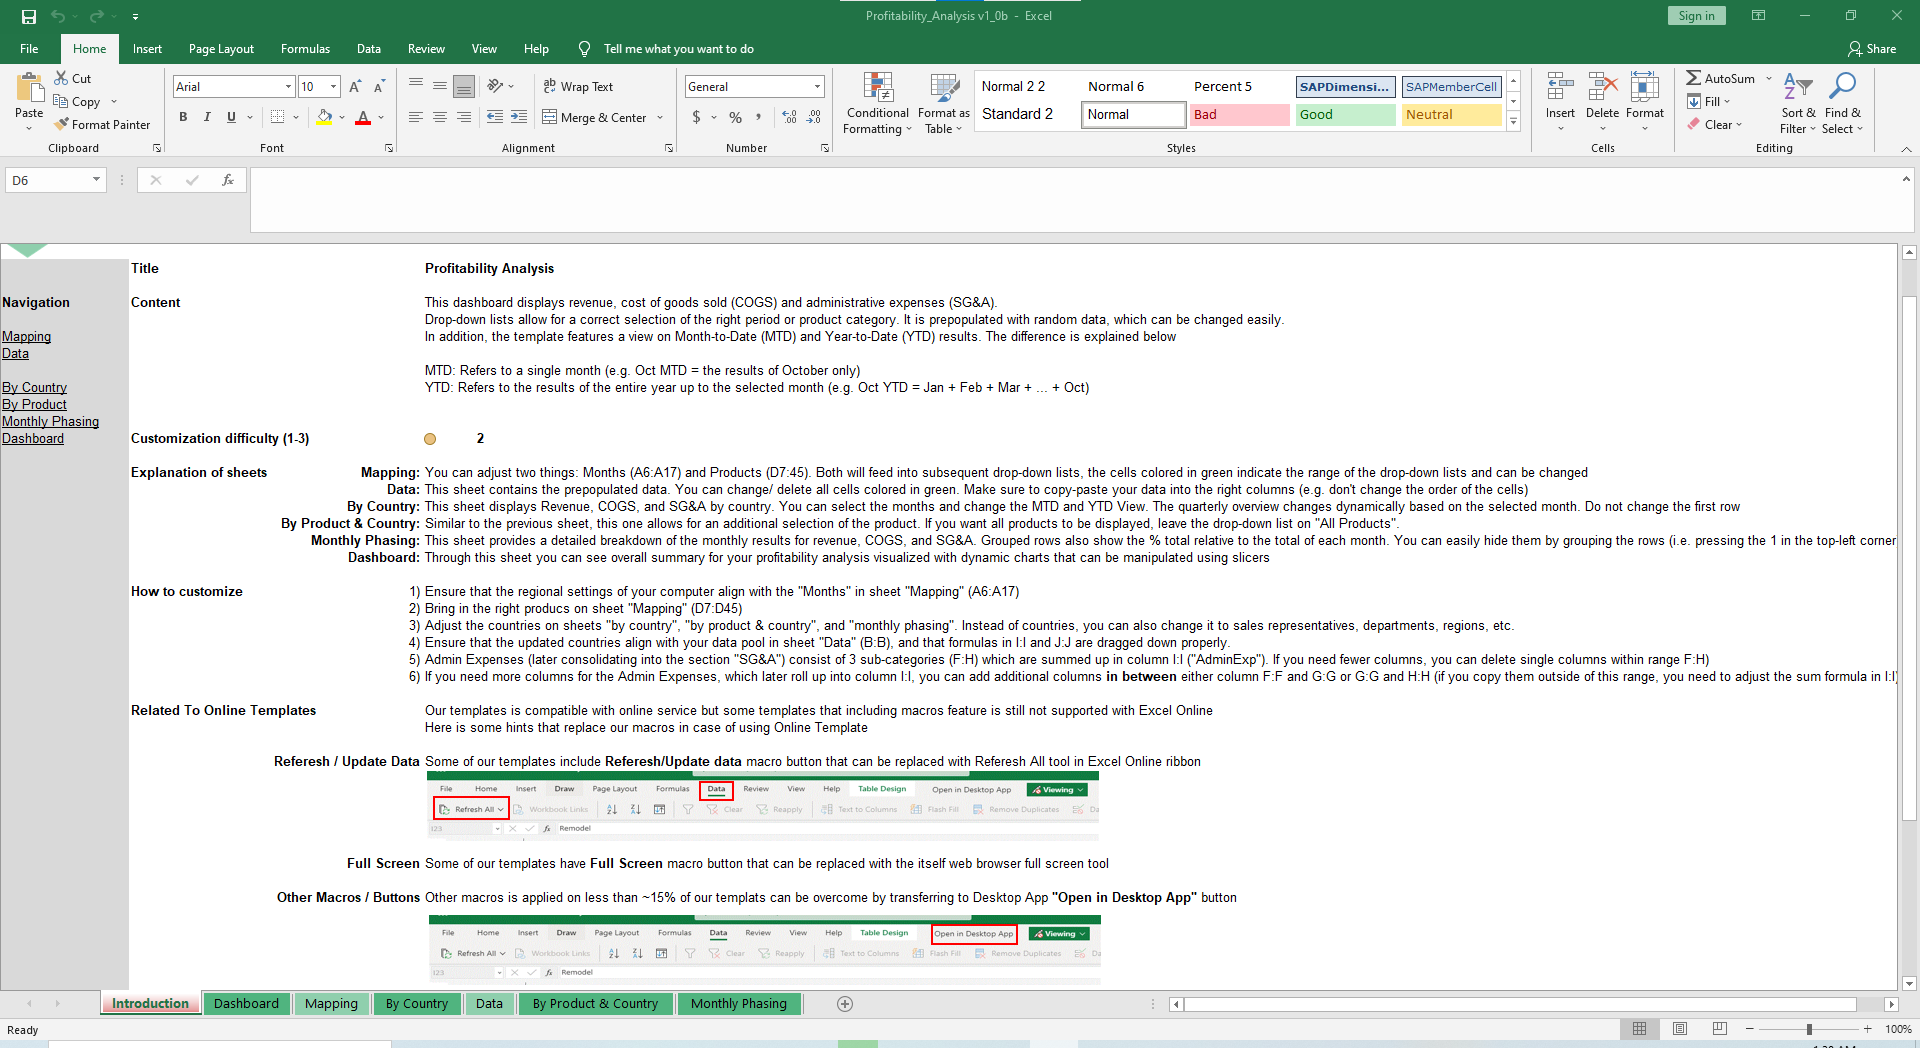
What's Inside the Profitability
Analysis Template?
Details | 7 Sheets
Supported Versions (All Features) | Excel 2013, 2016, 2019, Office 365 (Mac), Power BI*
Supported Versions (Significant Features) | Excel 2010, 2013, 2016, 2019, Office 365 (Mac), Power BI*, Google Sheets
Category | Management
Tags | Forecasting, Products, Sales, Margin, ROI

Why Professionals Choose Simple Sheets
It's simple. Access to the largest library of premium Excel Templates, plus world-class training.

100+ Professional Excel Templates
Optimized for use with Excel. Solve Excel problems in minutes, not hours.

World-Class Excel University
With our university, you'll learn how we make templates & how to make your own.

How-To Videos
Each template comes with a guide to use it along with how-to videos that show how it works.
Inside Our Profitability Analysis
Excel and Google Sheets Template
Shark Tank’s Lori Grenier often talks about ‘winners.’ She knows one when sees it. While an entrepreneur like her has the foresight to predict a cash cow before it blossoms, those within a business must be deeply analytical and see which products are currently winners versus duds.
That’s where our Product-Customer Wise Analysis Excel Template comes in handy. It makes it easy to analyze, track and optimize your product offering as it relates to a global customer base.
Analyze, track and optimize your product offerings, costs and ROI by customer base with our Product-Customer Wise Analysis Excel Template. Equipped with dynamic formulas, charts and graphs for easy visualization.
If you find this template useful, you’ll also want to check out our Year Wise Analysis and Competitor Price Analysis templates. Each will serve a different purpose, but will comprehensively help you determine what products or services are more profitable, whether you are charging too much and the trend of your sales.
Let’s dive into how to utilize this template.
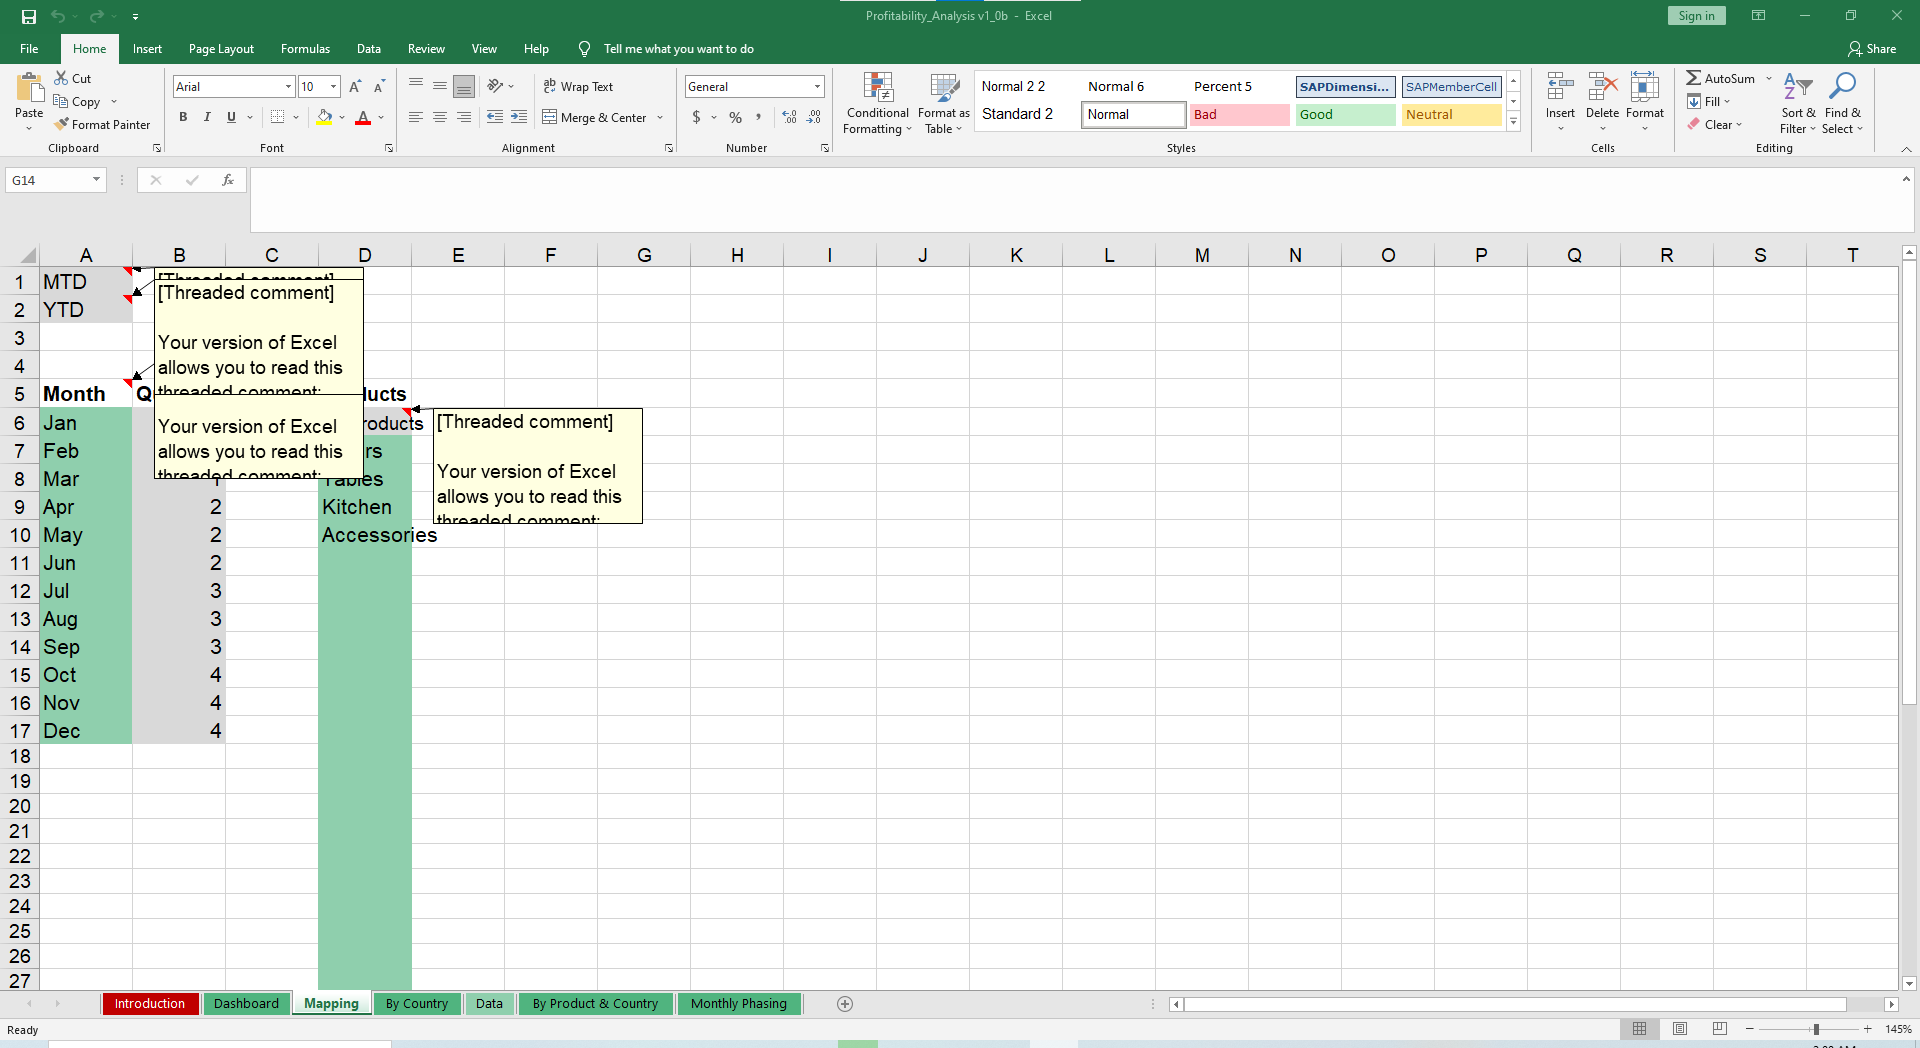
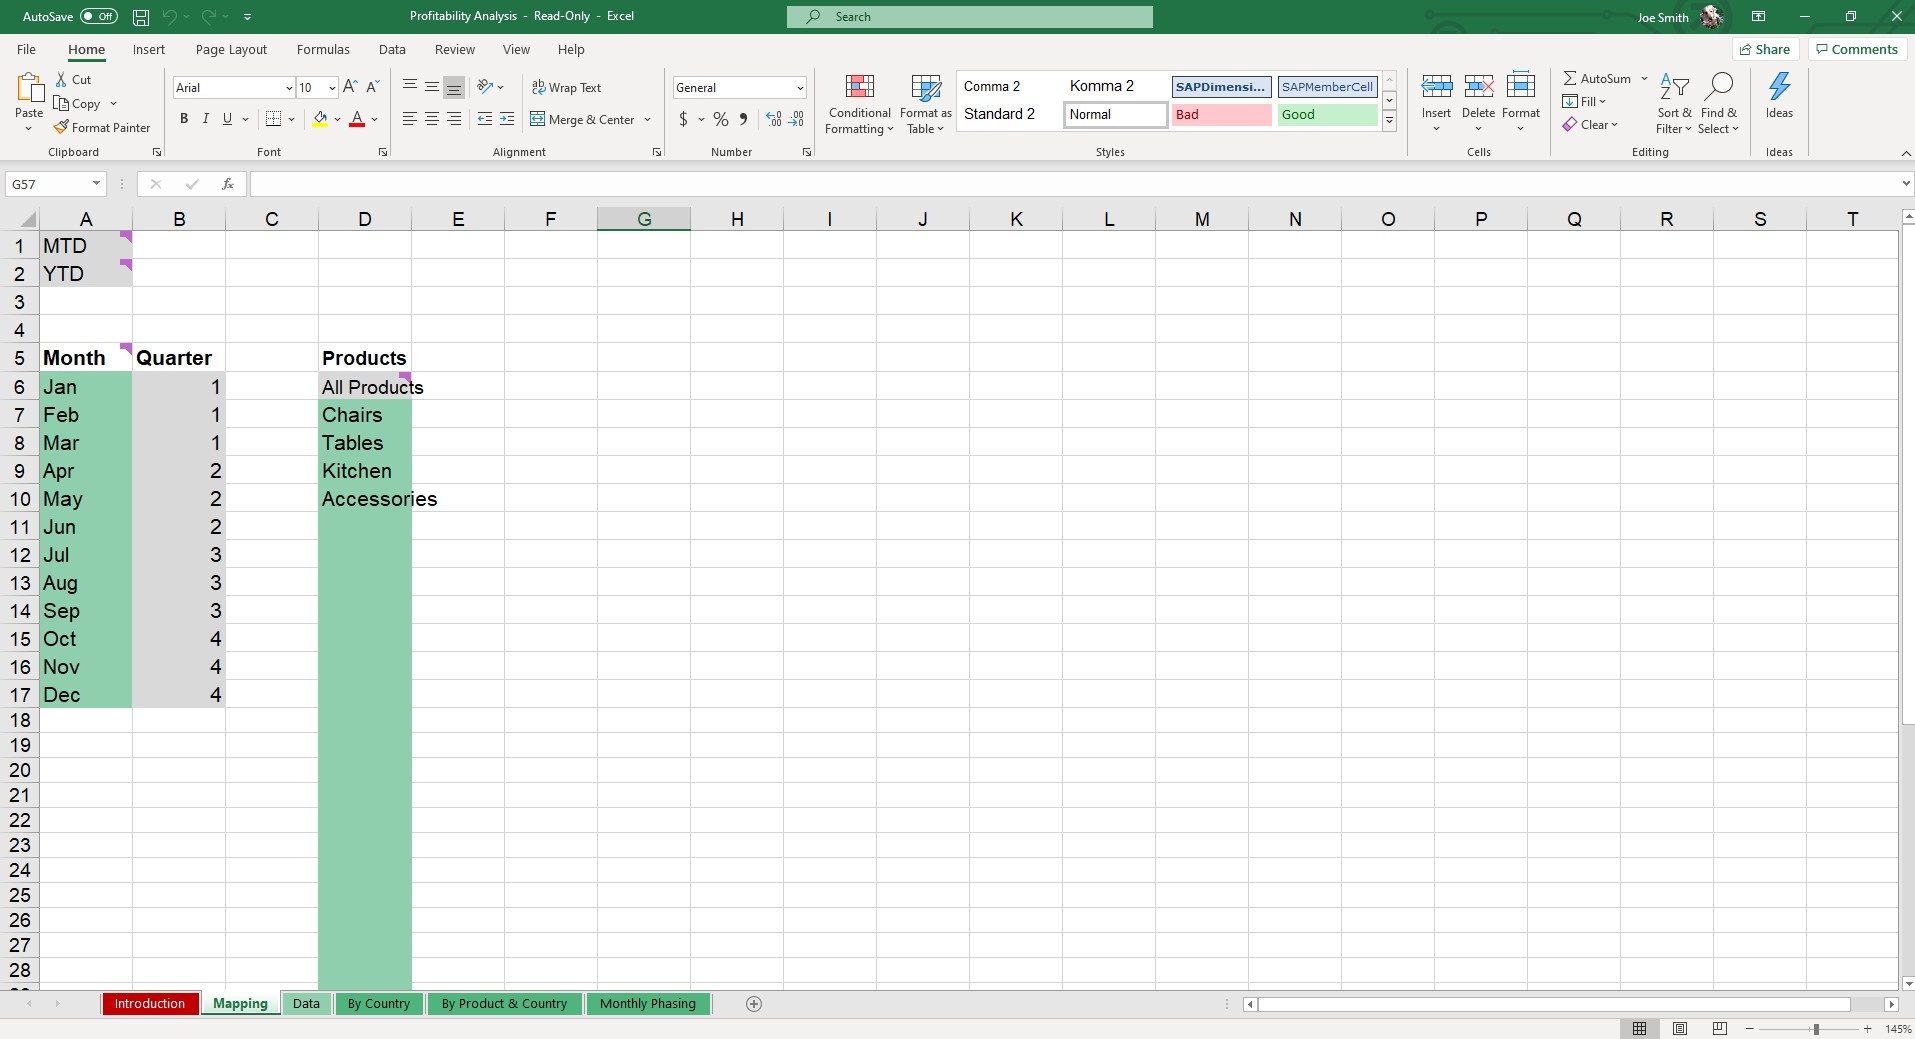
Start by customizing the Database sheet according to your organizational products and customer list. Fields include Product, Part Number, Sector, Item Cost, Item Price, Customer, Country and Region.
If you want to segment customers based on a different requirement, such as state, city or something non-geographically related, you can do that too.
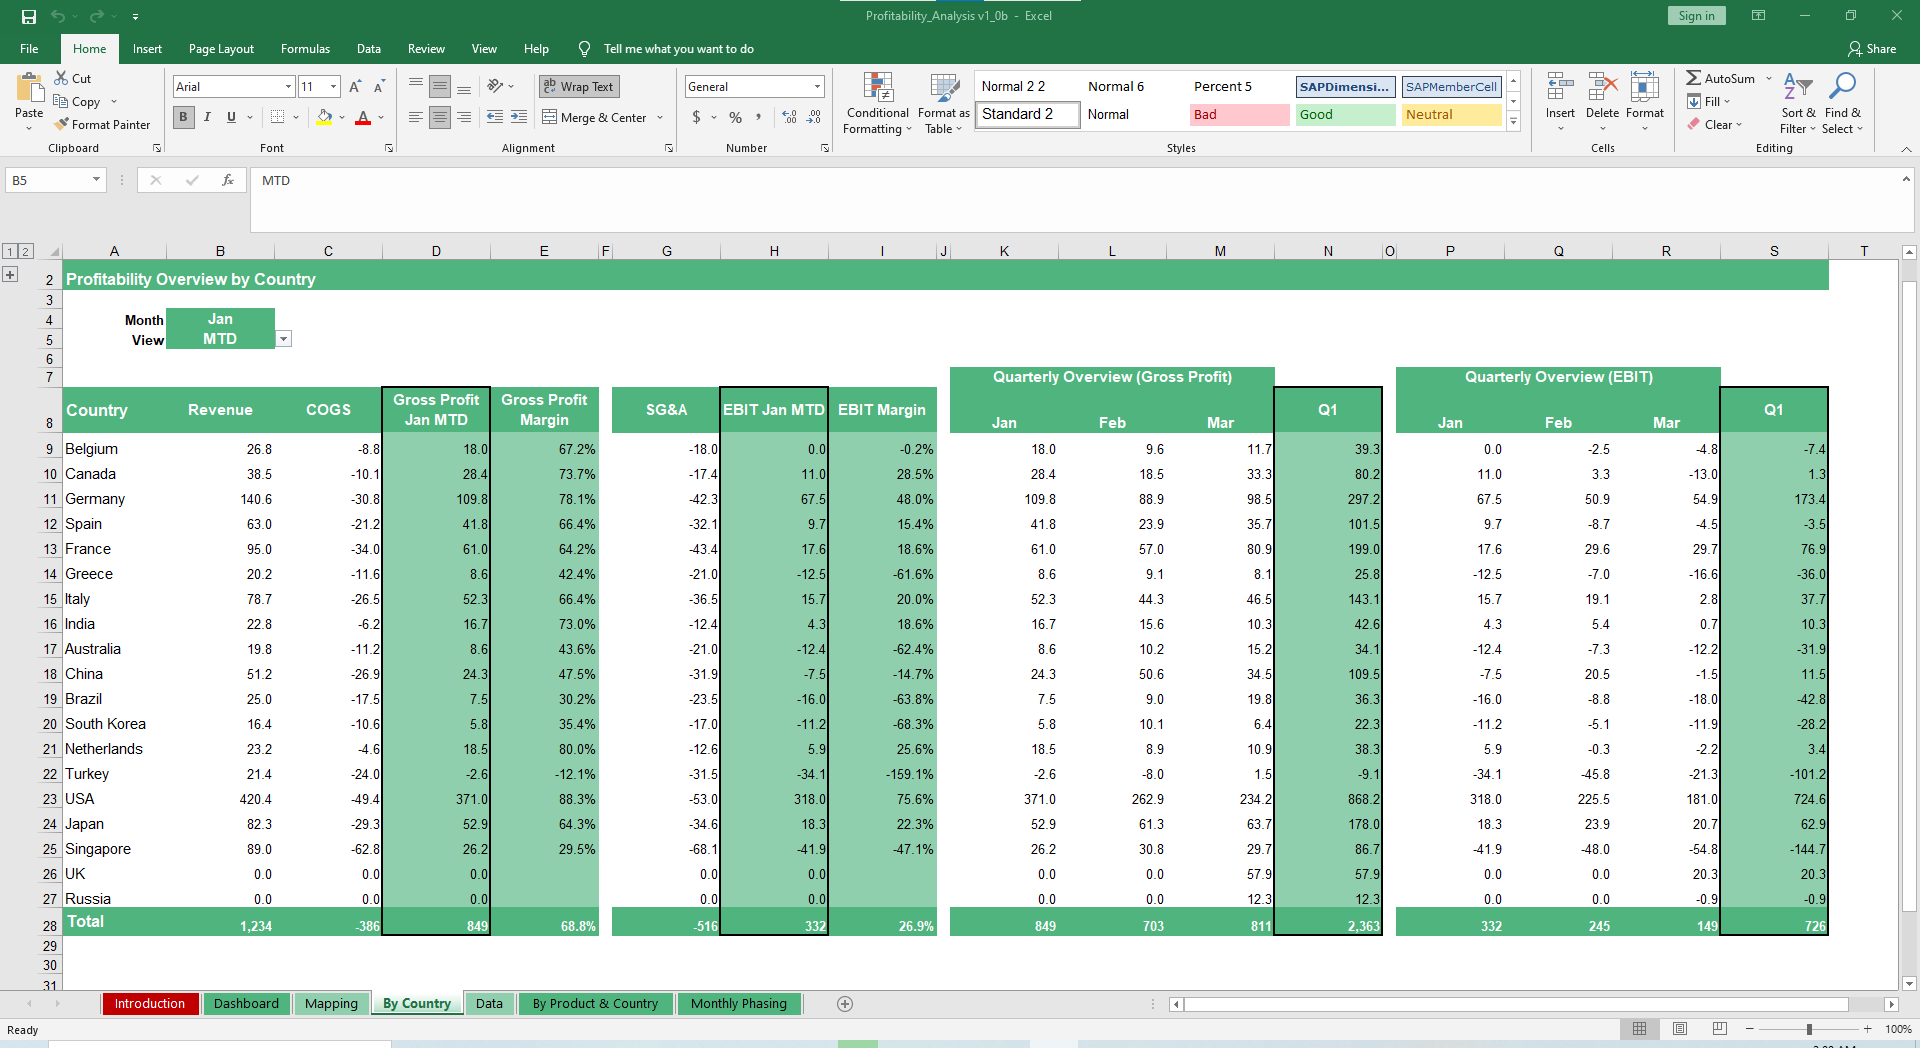
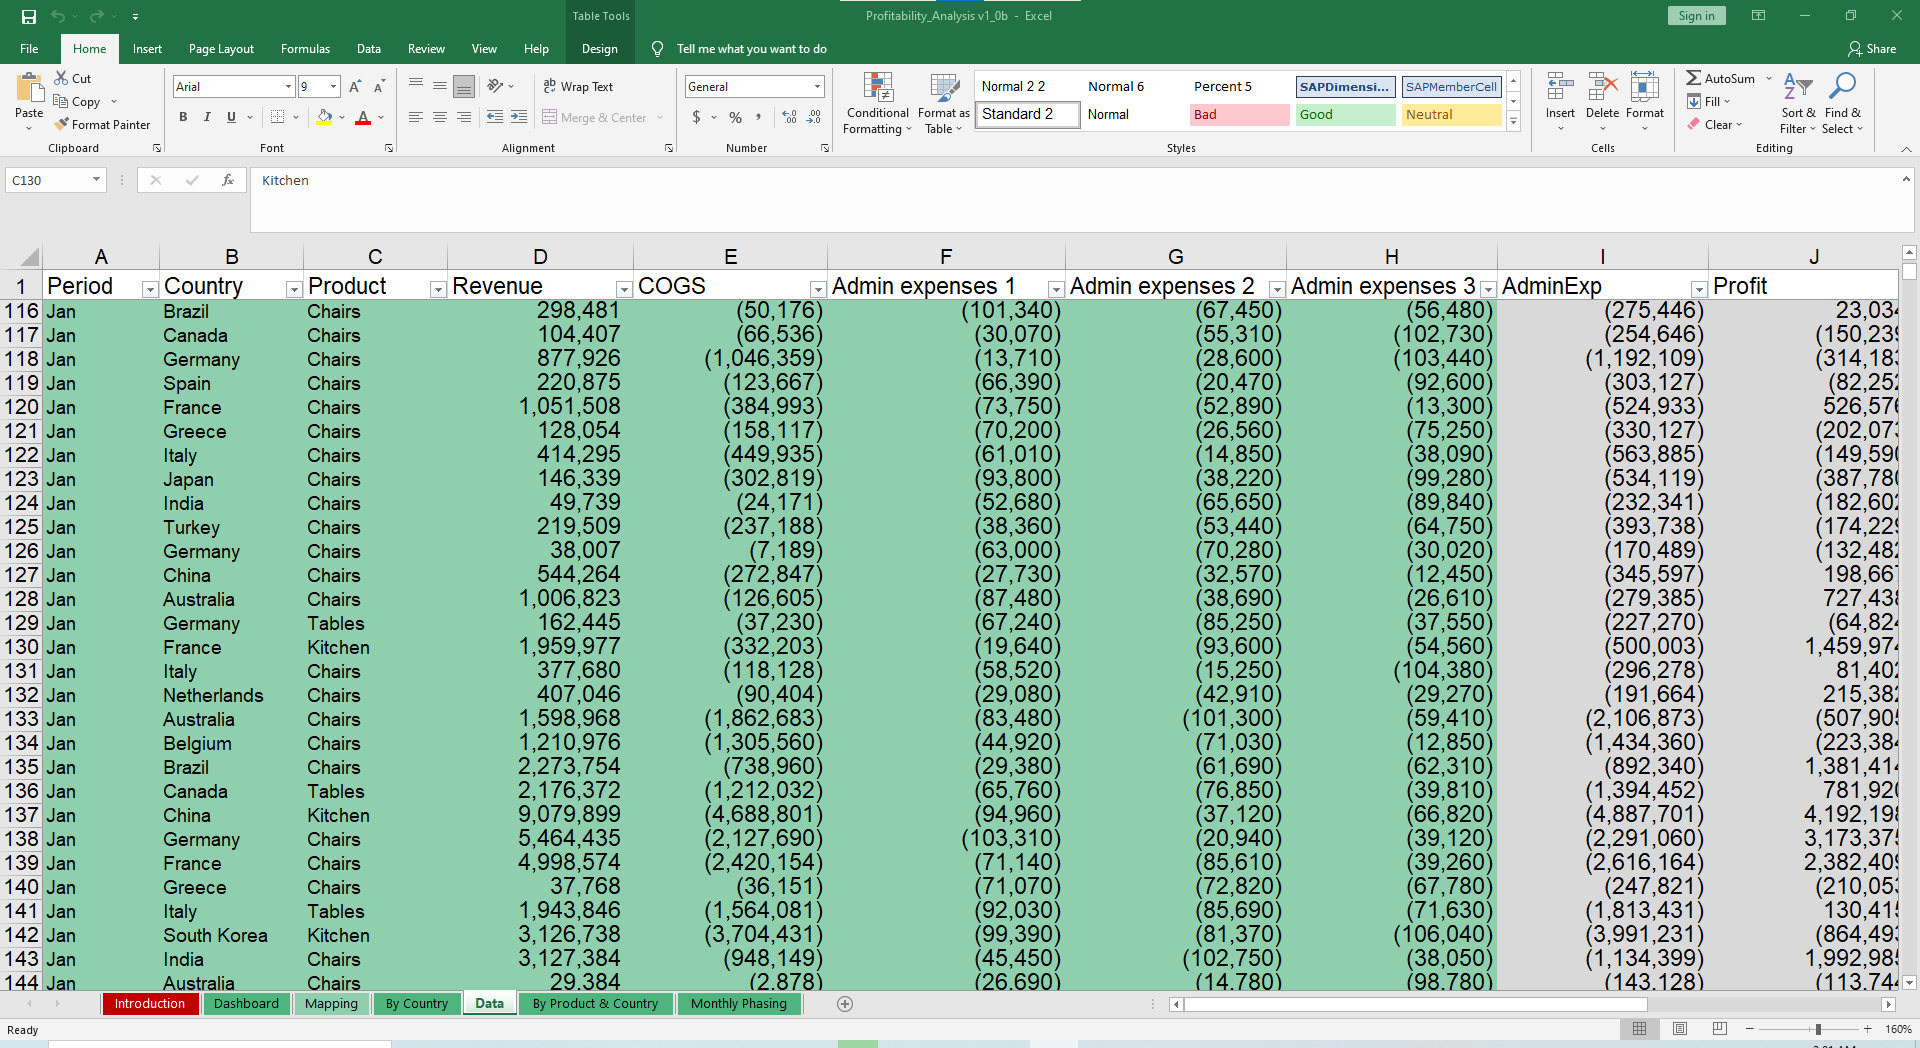
Move to the Raw Data sheet and input orders. While placeholder data is more B2B oriented, you can also input individual orders if you are B2C.
Certain fields will carry over and provide drop-down lists rather than you typing it in from scratch, making it easier to record data points and less likely you make errors.
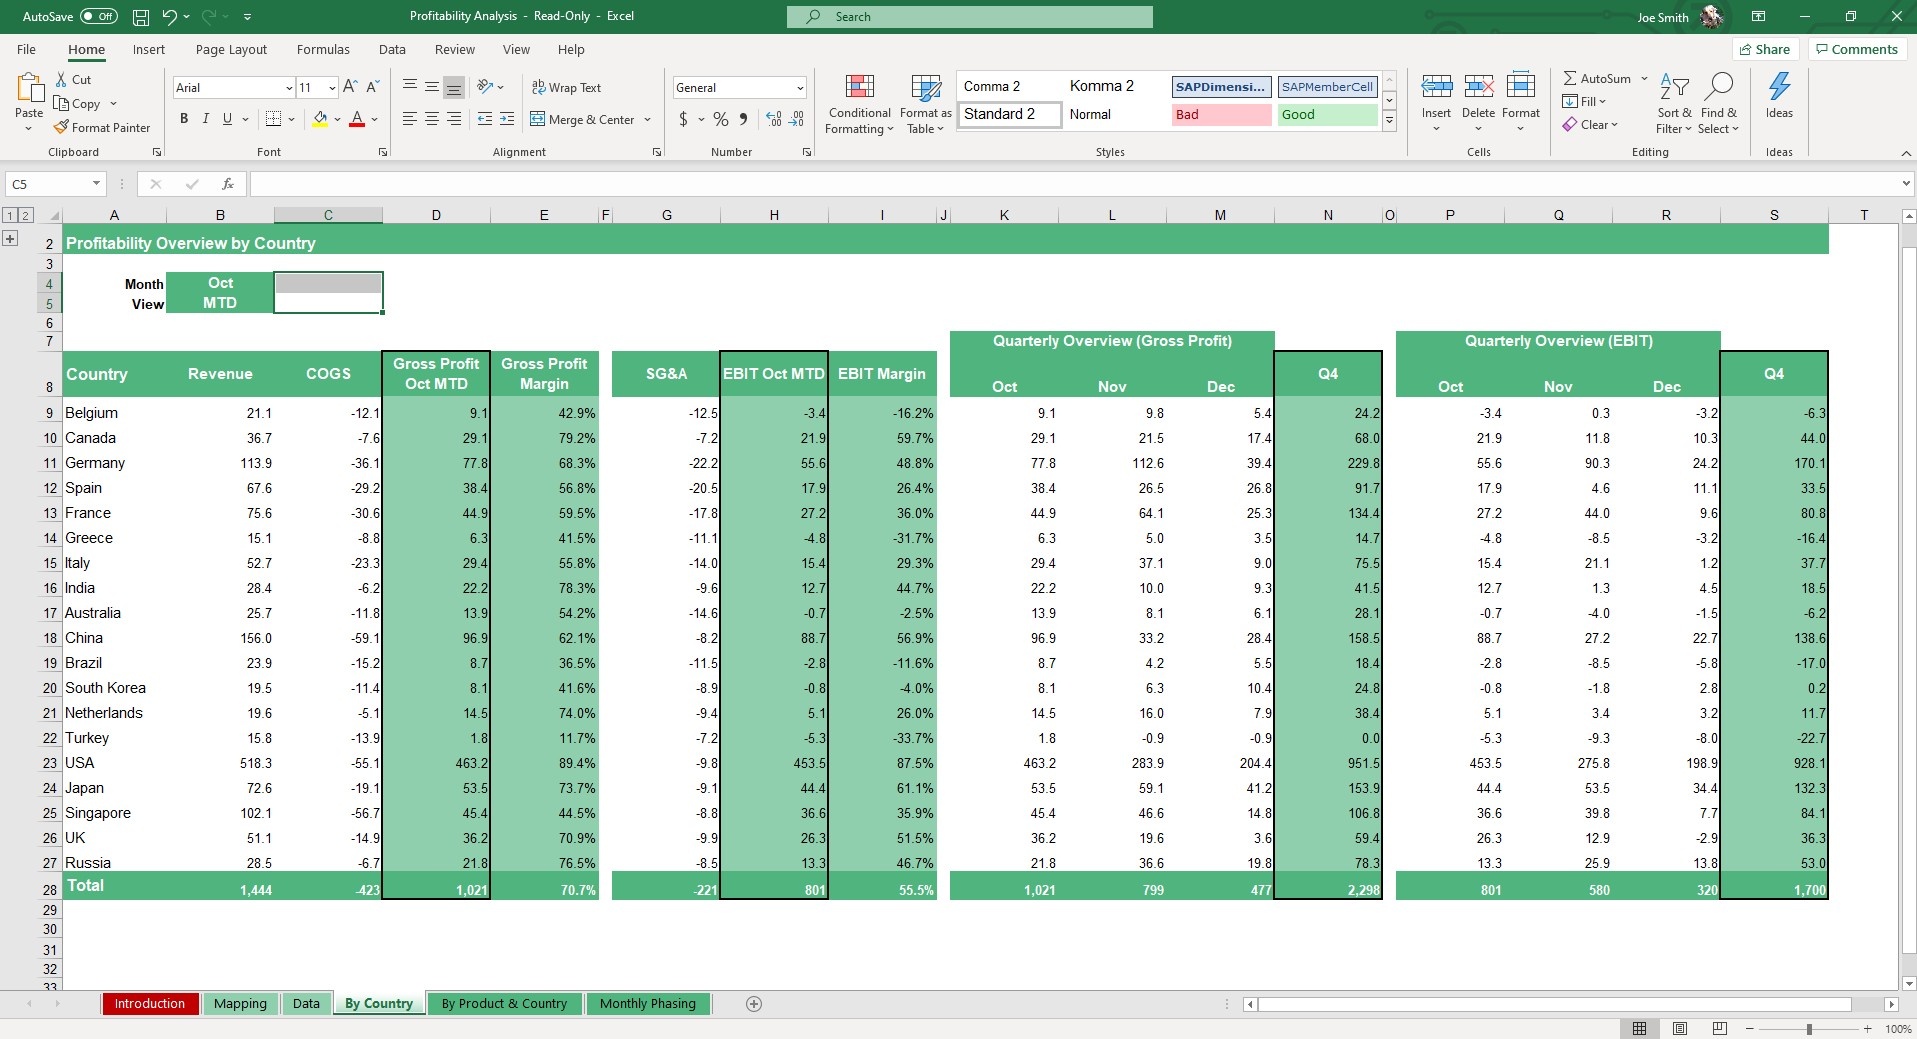
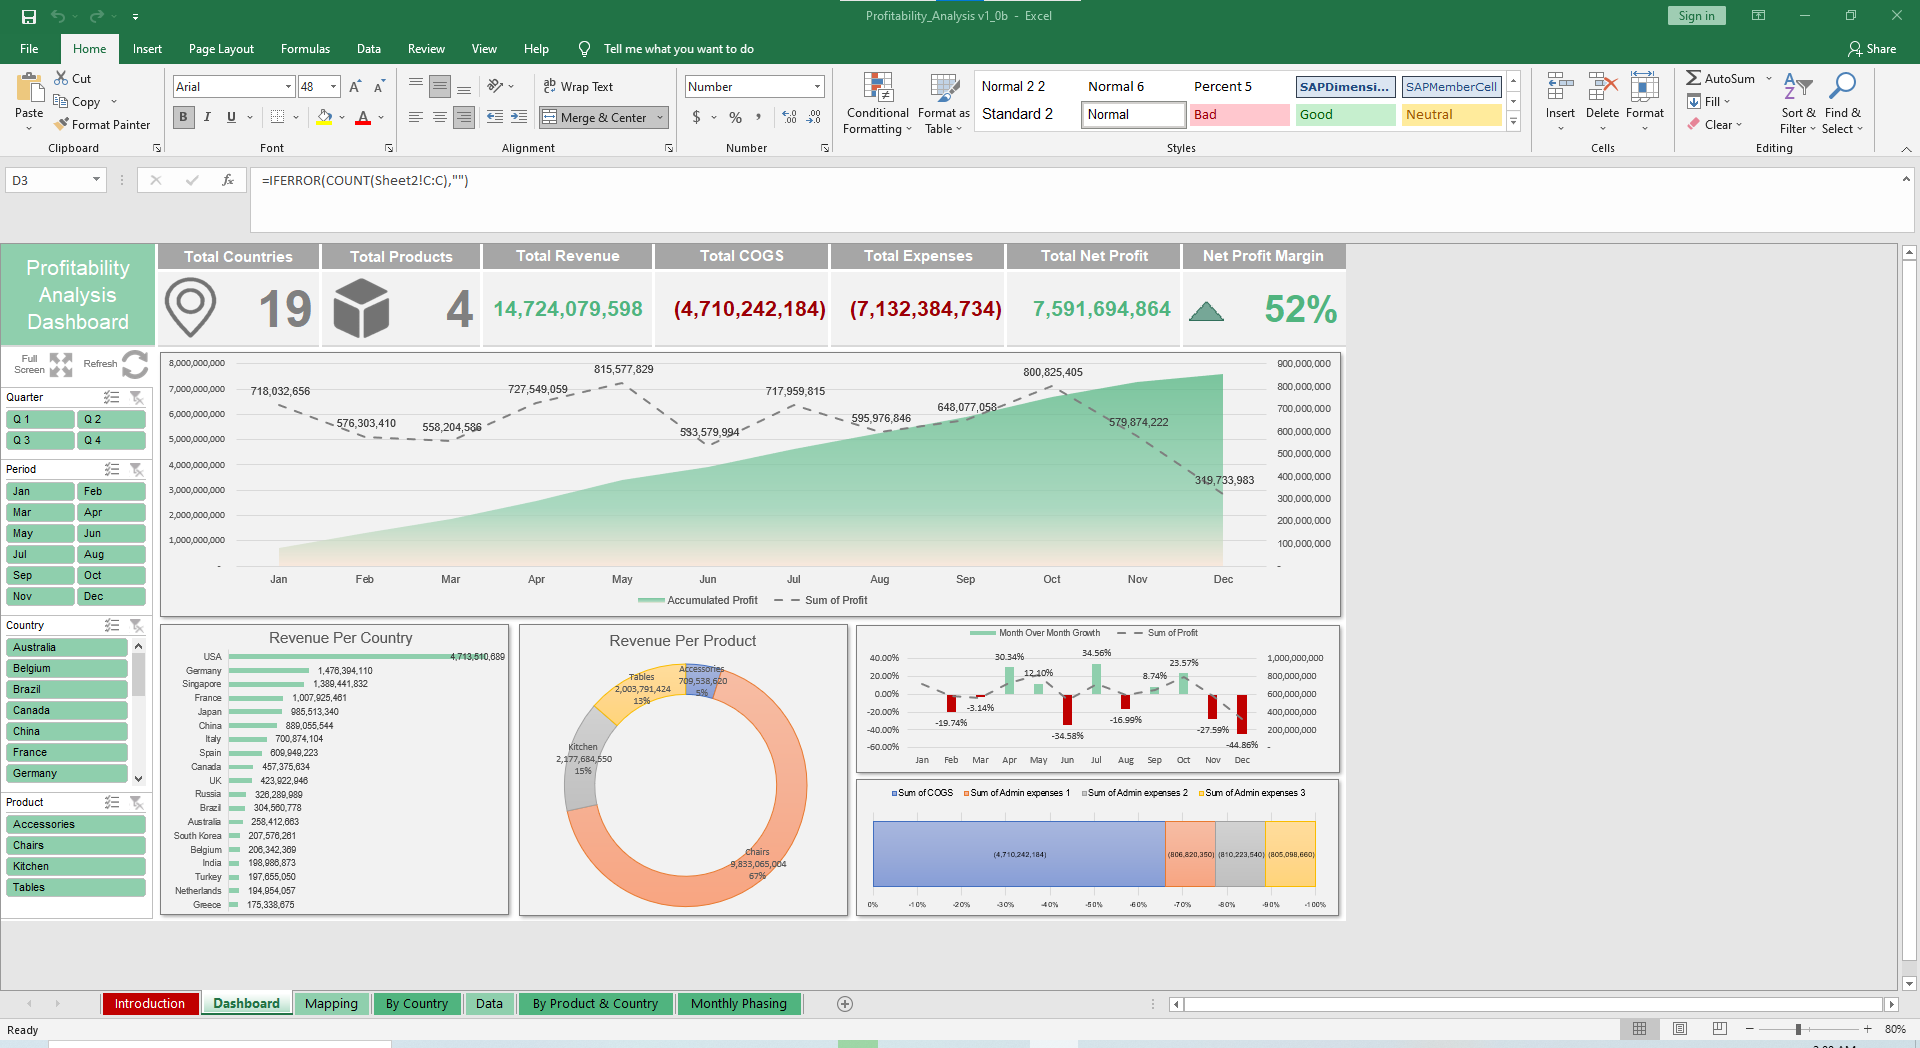
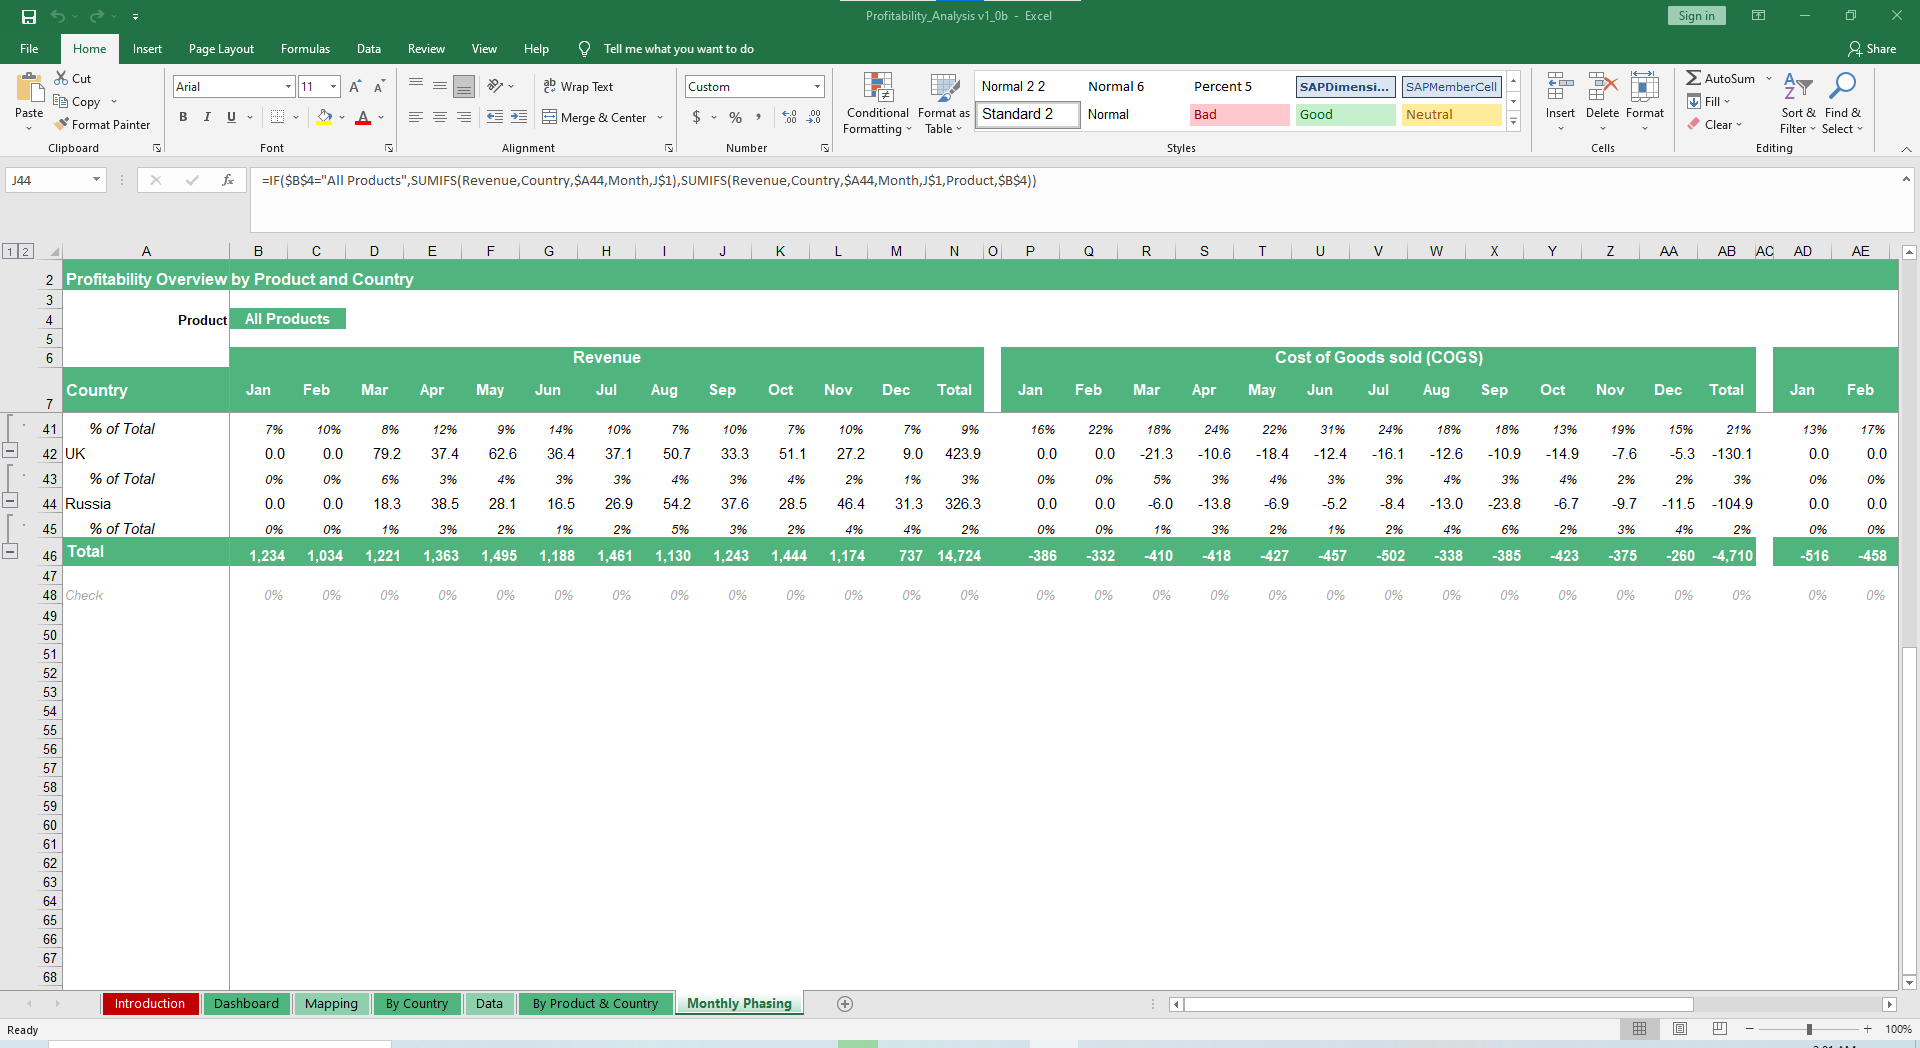
Once you input all related fields, hop over to the Dashboard sheet. Charts and graphs (line, bar and pie) will sync up to your data, just click the Refresh Data button sheet to ensure it’s using your most recent data.
Your Monthly Sales Quantity, Country Sales, Customer Sales Analysis, Product Sector Analysis and Revenue Map will be visually displayed to make your analysis easy and simple. This sort of data is far more digestible to colleagues, customers and bosses when it has context the ways visuals do.
To get an even deeper dive into the data, slicers allow you to filter by Sector, Product, Customer, Region and Country.
While we build most of our Excel templates with dynamic dashboards, Power BI is a Microsoft tool that allows for even greater visualization and customization.
We've paired our Profitability Analysis spreadsheet with a Power BI compatible dashboard that gives you further capabilities for filtering and analyzing your data.
In the bottom right-hand corner is a section with a map that showcases your product, profitability and any one metric you want to view by geography.
If that wasn't enough reason to get this template, did you know this template is compatible with Google Sheets? Collaborate with your co-workers in real time and enjoy the cloud auto-save feature of Sheets when you use this template!
*Power BI templates are only available for Mastermind Members.

More Management Templates For You


