
Everything You Need To Learn About Excel Standard Deviation
Apr 30, 2023
Do you want to understand how the Excel standard deviation works?
Knowing how to calculate the standard deviation in Excel helps you understand how spread out your data is. So, in this blog post, we'll share everything you need to know about this feature.
Get our free Excel formulas cheat sheet
Plus new tutorials and template drops. Enter your email and we'll send it over.
Read on as we cover the following:
-
Standard Deviation in Excel
-
Population Standard Deviation and Sample Standard Deviation
-
Standard Deviation Formula
-
Calculate Standard Deviation
-
Examples of Excel Standard Deviation Formula
-
Including Standard Deviation Bars in Excel
-
Final Thoughts on Excel Standard Deviation
-
Frequently Asked Questions on Excel Standard Deviation

Standard Deviation in Excel
The standard deviation tells you how different the numbers in a group are from the average. It shows if the numbers are close together or spread out.
Moreover, the standard deviation helps you determine whether the mean is a good representation of the entire data set's typical value:
-
A smaller standard deviation means that all the numbers in the group are closer together.
-
A standard deviation of 0 means that all the numbers are the same.
-
A bigger standard deviation means that the numbers in the group are more spread out. Moreover, they are less reliable for calculating an average.
Population Standard Deviation and Sample Standard Deviation
Standard deviation is usually associated with the terms "sample" and "population," which indicate your data's completeness and improved accuracy. Essentially, the difference between them is:
-
The population is the collection of all the elements in a data set.
-
A sample is a smaller data group containing at least one element from the larger population.
Standard Deviation Formula
Careful statistical data analysis is crucial because we use different math to find the population standard deviation and sample standard deviation.
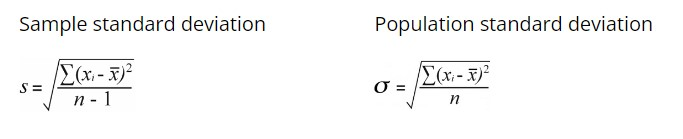
Where:
-
The variable "xi" represents the individual values in a data set.
-
The value of x is the average of all x values.
-
The variable n represents the total count of x values in the dataset.
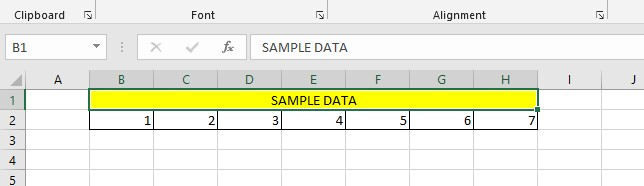
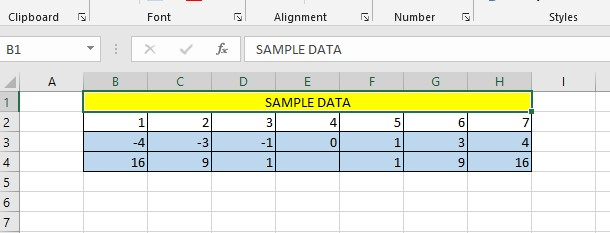
We'll break down the formulas into simpler steps to better understand them. To do this, let's begin with some example data:
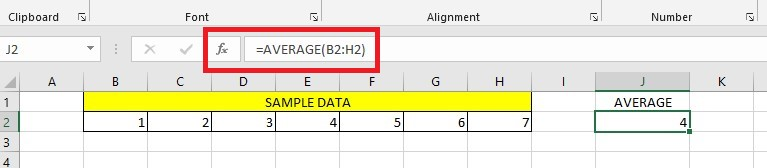
Get the Mean or Average
To get the mean of a data set, sum up all the values and then divide the sum by the total count of numbers in the entire data set.
To calculate the mean in Excel, use the AVERAGE function.
Square the Result After Subtracting the Mean
Squaring the result is part of the formula for calculating standard deviation that refers to:
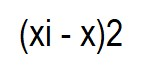
For this example, we'll determine the difference between each data point and 4. So, we'll use the mean of data analysis as 4.
Afterward, the differences are squared to obtain positive numbers.
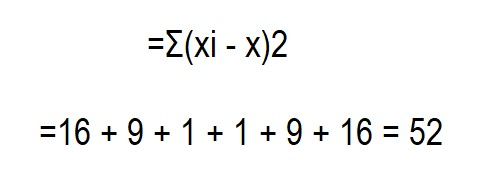
Calculate the Sum of Squared Differences
In math, the symbol Σ is like a plus sign. It means "add up." We can use it to add all the numbers squared in this part of the equation:
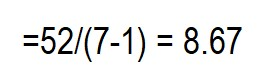
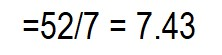
Get the Mean by Dividing the Sum of Squared Differences by the Number of Values
The sample and population standard deviation formulas were the same but diverged.
To obtain the sample variance from the standard deviation, divide the sum of squared differences by the sample size minus 1.
To calculate the population standard deviation, divide the sum of squared differences by the total number of differences. You'll get the mean of squared differences.
What causes the difference in formulas? The formula for sample standard deviation adjusts for estimating a sample mean rather than the true population means. This can be achieved through Bessel's correction, where the formula uses n - 1 instead of n.
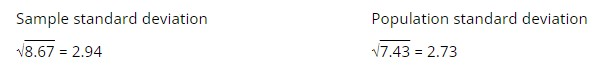
Calculate the Square Root
To calculate the standard deviation, round your result to two decimal places after taking the square root of the numbers provided in the equations below.
When using Microsoft Excel, the standard deviation is calculated in the same way as described earlier. Still, it is done automatically without requiring you to perform those calculations manually.
Calculate the Standard Deviation
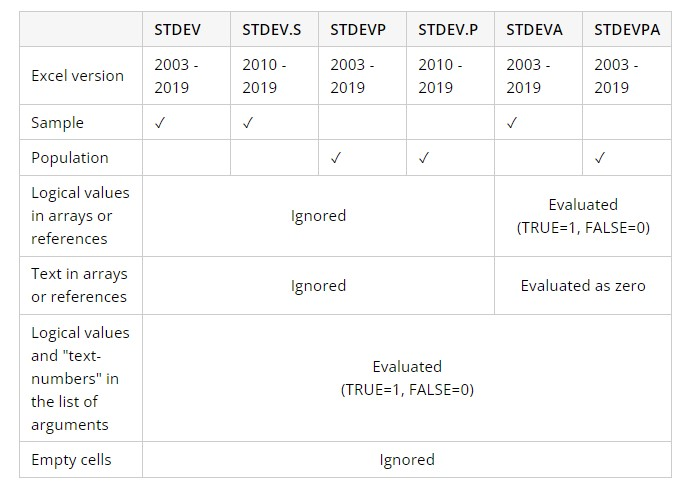
There are six different functions in Excel to find the standard deviation. Your function depends on whether you work with the entire or sample population.
Calculate Sample Standard Deviation in Excel Using Functions
To find the standard deviation of a sample, use one of the formulas based on the "n-1" method provided below.
STDEV function in Excel
STDEV is a feature in Excel from 2003 to 2019. It helps you determine the standard deviation by counting the numbers, not the empty cells or text. TRUE/FALSE and error values are also not counted.
STDEV.S function in Excel
STDEV.S accepts the same arguments as STDEV. The STDEV.S function is similar to STDEV in that it calculates the sample standard deviation of a set of values using the classic formula discussed earlier.
STDEVA function in Excel
The STDEVA function in Excel is to calculate a sample's standard deviation. It is similar to the other two standard deviation calculation functions but handles logical and text values differently.
-
The COUNT function works with numbers, TRUE and FALSE statements, and text.
-
TRUE is the same as one, and FALSE is the same as 0. Text-like words or empty strings will count as 0. If you put numbers as words, they will show as real numbers.
-
The STDEVA function does not interfere with blank cells.
The sample standard deviation formula requires the arguments to have at least two numeric values to function properly. Without them, the formula will result in the error message #DIV/0!
Using Excel Functions to Calculate Population Standard Deviation
To calculate the standard deviation in Excel for the entire population, use one of the functions below based on the "n" method.
The STDEVP function in Excel
The STDEVP function in Excel calculates a population's standard deviation.
The STDEV.P function in Excel
The STDEV.P function is better than the STDEVP function because it is more accurate. Both functions help determine how many numbers differ in an array or group. You can also include TRUE/FALSE values and words when using STDEV.P and STDEVP.
The STDEVPA function in Excel
The STDEVPA function calculates the standard deviation of a population, which can include non-numeric and numerical values, such as text and logical values. The behavior for non-numeric values is the same as that of the STDEVA function.
Which Standard Deviation Function in Excel Should You Use?
Excel has different ways to calculate the standard deviation, which can be confusing.
-
The STDEV.S and STDEV functions in Excel 2010 and earlier are for samples or groups of numbers.
-
To find the standard deviation of a population, use the STDEV.P or STDEVP functions in Excel 2010 or earlier versions.
-
To include text and other values in your calculation, use the STDEVA or STDEVPA functions.
Examples of Excel Standard Deviation Formula
Writing the formula for standard deviation in Excel is easy once you have selected the appropriate function for your data type. The Excel function name's syntax is straightforward and clear, which minimizes the possibility of errors.
The examples below illustrate how to use a few standard deviation formulas in Excel:
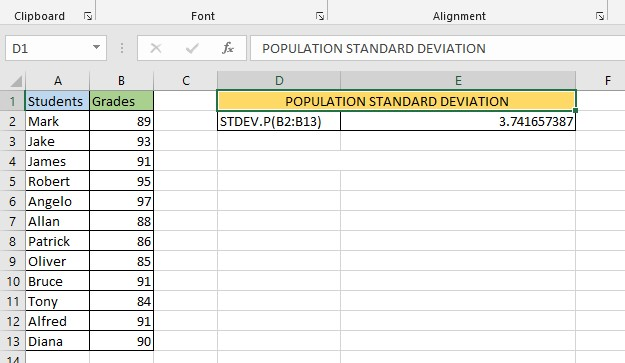
Find the Standard Deviation of a Sample and a Population
You can find the standard deviation for the entire population using the STDEV.P function.
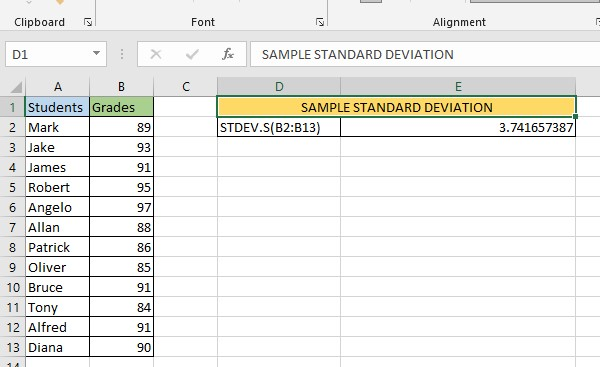
Use the STDEV.S function to calculate the standard deviation for a sample subset of a population.
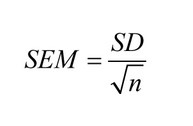
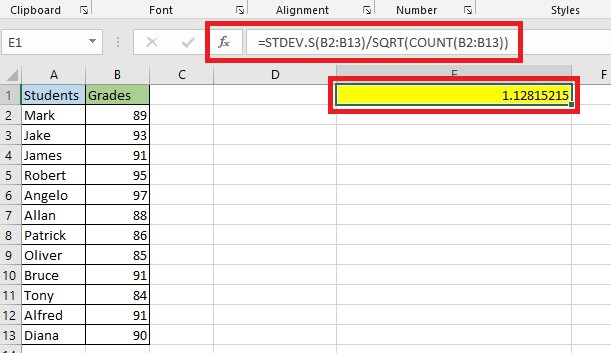
Find the Standard Error of the Mean in Excel
The standard error of the mean is another measure of variability in data used in statistics. However, some people mistake it for the standard deviation measures of error, which need to be more accurate.
You must understand that the mean's standard deviation and standard error are related concepts but are not the same.
To find the standard error of the average in math, use the formula below:
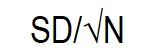
To obtain the standard deviation, use the formula:
You can use the COUNT function in Excel to discover how many numbers are in your sample. Then, use the SQRT and STDEV.S functions to find the standard deviation of that sample.
By combining all the information, you can derive the standard error of the mean formula using Excel.
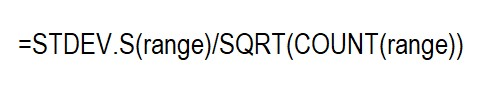
To calculate the SEM, we will use the sample data in B2:B13. Follow this formula:
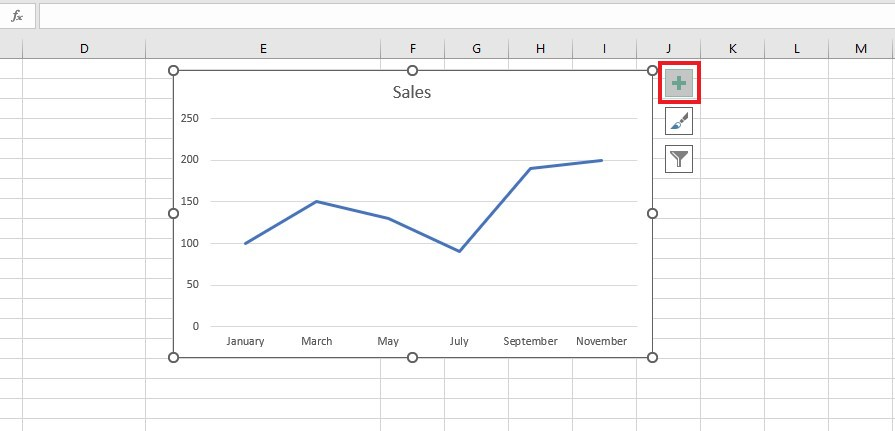
Include Standard Deviation Bars in Excel
You can include standard deviation bars in your Excel chart to represent the standard deviation margin visually. Here are the steps:
-
Click your graph and click the Chart Elements button.
-
To choose the option for displaying standard deviation, click the arrow next to "Error Bars." Now, to display the standard error of the mean, select the "Standard Error" option.
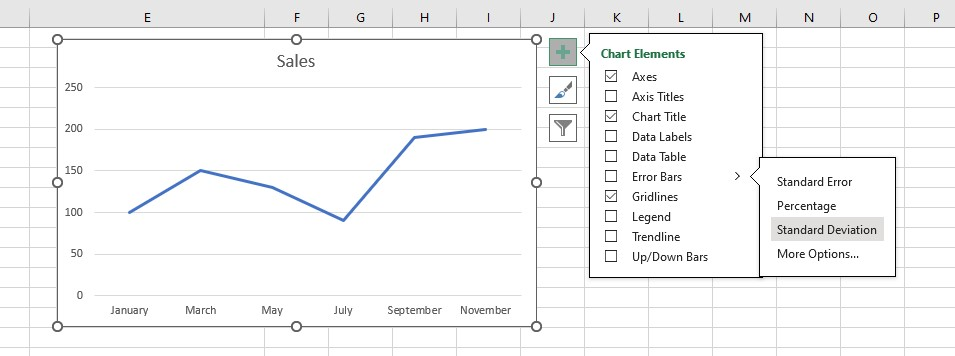
The error bars in the graph will be the same for all data points.
Final Thoughts on Excel Standard Deviation
Knowing how to calculate standard deviation in Excel is helpful. Set up the spreadsheet correctly and use the STDEV and STDEVA functions to get basic or sample standard deviation calculations with text values.
For more easy-to-follow guides, visit Simple Sheets and the Related Articles section of this blog post. Subscribe to Simple Sheets on Youtube for the most straightforward Excel video tutorials!
Frequently Asked Questions on Excel Standard Deviation
Does Microsoft Excel calculate the STDEV.S or STDEV.P when you include standard deviation from Error Bars in the Add Chart Element option?
Excel standard deviation function to decide how wide the error bars should be. It looks at all the numbers in a data set and makes them all equal.
Is standard deviation important for marketers?
The average value of data can help you find good investments. The standard deviation can tell you how risky or rewarding an investment might be.
Which function should I use in Excel, STDEV.S or STDEV.P?
To figure out the standard deviation for a certain group of people, use the STDEV.S function. To find the standard deviation for everyone in a population, use the STDEV.P function.
Want to Make Excel Work for You? Try out 5 Amazing Excel Templates & 5 Unique Lessons
We hate SPAM. We will never sell your information, for any reason.

