Simplest Guide: How To Calculate Margin Of Error In Excel
Mar 20, 2023
Last updated: August 23, 2026
Quick answer
The fastest way to calculate the margin of error in Excel is =CONFIDENCE.NORM(0.05, STDEV.S(A2:A101), COUNT(A2:A101)), which returns the 95 percent margin of error in one step. The long form is margin of error = z times (standard deviation / square root of n), where z is 1.96 at 95 percent confidence.
Do you need a hand figuring out how to calculate the margin of error in Excel? It can be challenging, especially if you struggle with math.
You're in luck, because this guide explains how to use Microsoft Excel to calculate a margin of error, with every formula written out so you can copy it. We cover the one-function shortcut, the manual method that shows you what is actually happening, the version for percentages and poll results, and how to work backwards from a confidence interval you already have.
Get our free Excel formulas cheat sheet
Plus new tutorials and template drops. Enter your email and we'll send it over.
What this guide covers
- What is the margin of error?
- What is the margin of error formula?
- The one-function method: CONFIDENCE.NORM
- The manual method, step by step
- Margin of error for a percentage or poll result
- How to find the margin of error from a confidence interval
- How does sample size change the margin of error?
- Z values by confidence level
- Why is your margin of error wrong?
- Frequently asked questions
What Is the Margin of Error?
The margin of error is the amount you add to and subtract from a sample result to get the range the true population value probably sits in. When the margin of error is low, your estimate is more precise. The higher it is, the less certain you can be about where the real answer lies.
If a survey of 400 people finds 52 percent support with a margin of error of 5 percentage points at 95 percent confidence, the honest reading is "somewhere between 47 and 57 percent, and we would expect that range to contain the true value 95 times out of 100 if we repeated the survey".
The rule: the margin of error is half the width of a confidence interval. Every formula below is a way of getting that half-width.
What is the margin of error formula?
Written out in plain characters, for a mean:
margin of error = z × (s / √n)
where z is the critical value for your confidence level (1.96 at 95 percent), s is the standard deviation and n is the sample size. The bracketed part, s divided by the square root of n, is the standard error. So a shorter way to say the same thing is:
margin of error = z × standard error
Standard deviation and standard error are not the same thing and are not interchangeable. Standard deviation describes how spread out your individual data points are. Standard error describes how much your sample average would bounce around if you took the sample again. You divide the first by the square root of n to get the second. Using the standard deviation where the formula wants the standard error will make your margin of error far too large.
In Excel that translates directly to:
=NORM.S.INV(0.975) * (STDEV.S(A2:A101) / SQRT(COUNT(A2:A101)))
The one-function method: CONFIDENCE.NORM
Excel has a function that does the whole calculation in one step, and most tutorials skip it. CONFIDENCE.NORM returns exactly the margin of error, the plus-or-minus figure, not the full interval.
=CONFIDENCE.NORM(alpha, standard_dev, size)
- alpha is the significance level. Microsoft states that the confidence level equals 100 times (1 minus alpha), so alpha of 0.05 means 95 percent confidence. Use 0.10 for 90 percent and 0.01 for 99 percent.
- standard_dev is the standard deviation.
- size is the sample size.
Pointed at a column of data, that becomes a single formula:
=CONFIDENCE.NORM(0.05, STDEV.S(A2:A101), COUNT(A2:A101))
To turn it into the full interval, put the mean either side of it: the interval runs from =AVERAGE(A2:A101)-D2 to =AVERAGE(A2:A101)+D2, where D2 holds the margin of error.
CONFIDENCE.T when you do not know the population standard deviation
Microsoft's documentation is explicit that CONFIDENCE.NORM assumes the population standard deviation is known. In real survey work it almost never is, you are estimating it from the sample. In that case the t distribution is the correct choice:
=CONFIDENCE.T(0.05, STDEV.S(A2:A101), COUNT(A2:A101))
When it matters: below roughly 30 observations the two answers diverge noticeably and CONFIDENCE.T gives the wider, more honest number. Above about 100 they are close enough that the choice rarely changes a decision. If your sample is small, use CONFIDENCE.T.
Two errors these functions throw
Both return #NUM! if the standard deviation is zero or negative, and if the size is less than 1. A standard deviation of zero means every value in your range is identical, which usually points at a broken reference rather than a real dataset.
The manual method, step by step
The one-function version is faster, but building it by hand shows you which piece is driving the answer, and it is what most statistics courses ask for. Here it is on a column of survey respondent ages in A2:A101.
Read Also: How to calculate confidence interval in Excel.
Calculate the Margin of Error with Standard Deviation
-
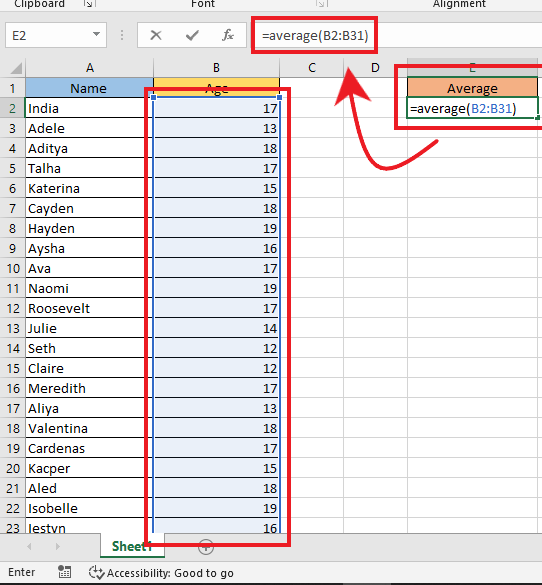
Get the average. In an empty cell, enter =AVERAGE(A2:A101). You do not need this for the margin of error itself, but you need it to state the final interval.
-
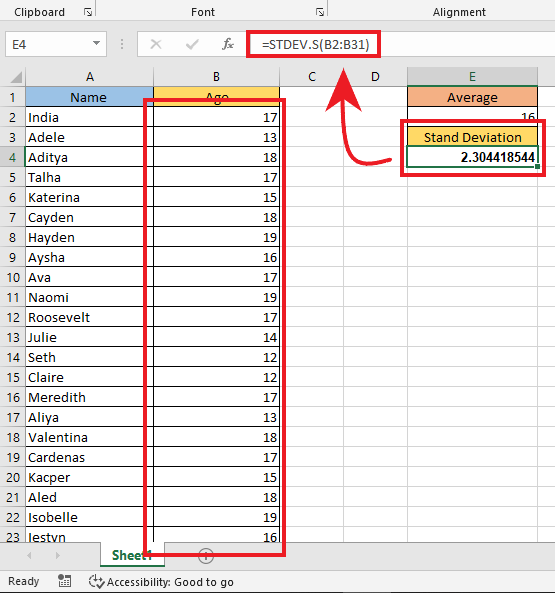
Get the standard deviation. Enter =STDEV.S(A2:A101) for a sample, or =STDEV.P(A2:A101) if your rows really are the entire population. Almost always you want STDEV.S.
-
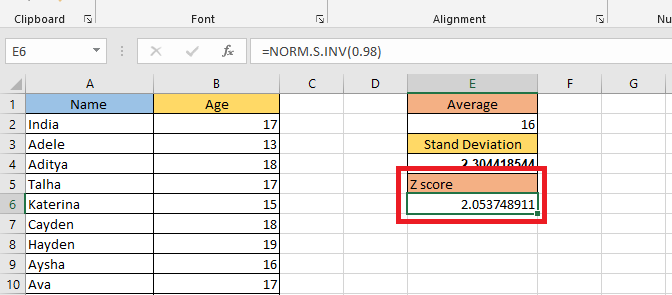
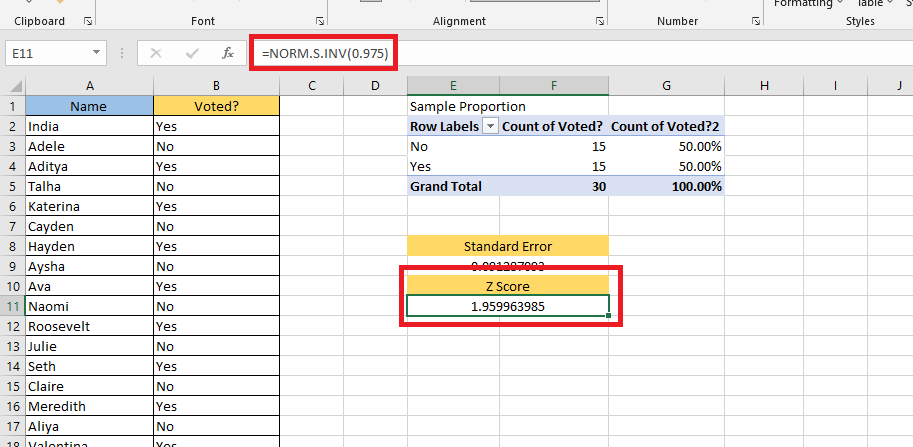
Get the z critical value. For a two-tailed 95 percent confidence level, enter =NORM.S.INV(0.975), which returns 1.959964. The 0.975 is not a typo and it is not a sample proportion: 95 percent confidence leaves 5 percent split between two tails, so 2.5 percent sits above your upper limit, and the cumulative probability you feed NORM.S.INV is 1 minus 0.025.
-
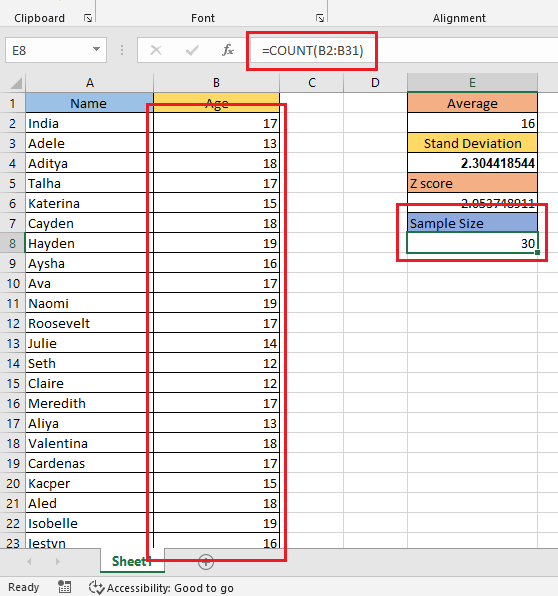
Get the sample size. Enter =COUNT(A2:A101). COUNT ignores blanks and text, which is what you want, because a blank row is not a respondent.
-
Combine them. If the standard deviation is in D2, the z value in D3 and the sample size in D4, the margin of error is =D3*(D2/SQRT(D4)). Your result is the plus-or-minus figure to report alongside the average.
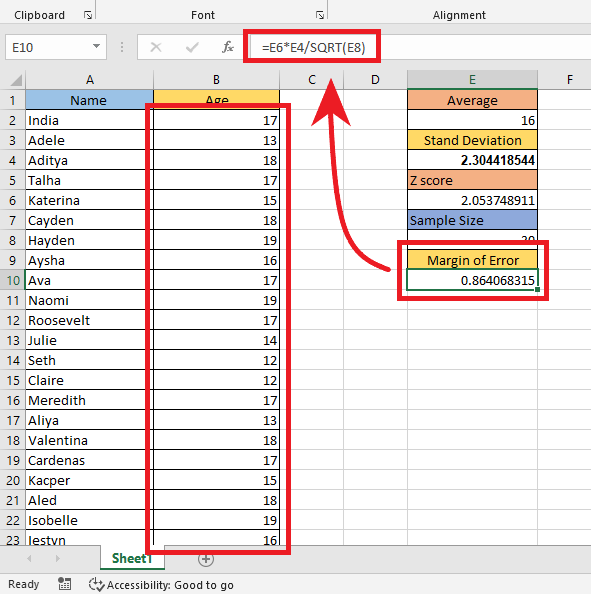
That answer should match =CONFIDENCE.NORM(0.05, D2, D4) to several decimal places. If it does not, one of the five cells is pointing somewhere unexpected.
Read Also: #SPILL! Error in Excel - What It Means and How to Fix
Margin of error for a percentage or poll result
When your result is a percentage rather than an average, "45 percent voted yes" rather than "the average age is 38", the standard error is calculated differently and CONFIDENCE.NORM does not apply. The formula becomes:
margin of error = z × √( p × (1 - p) / n )
where p is the sample proportion expressed as a decimal. In Excel, with p in D1 and n in D2:
=NORM.S.INV(0.975)*SQRT(D1*(1-D1)/D2)
Here is how to get p out of raw response data with a pivot table.
-
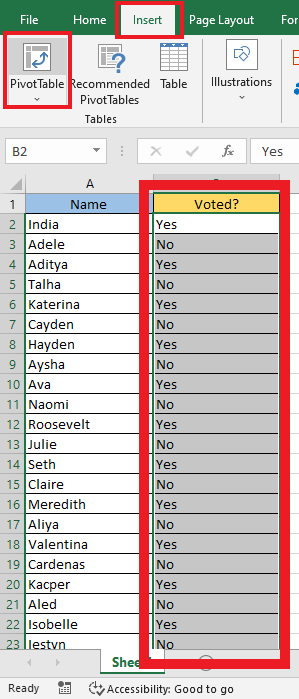
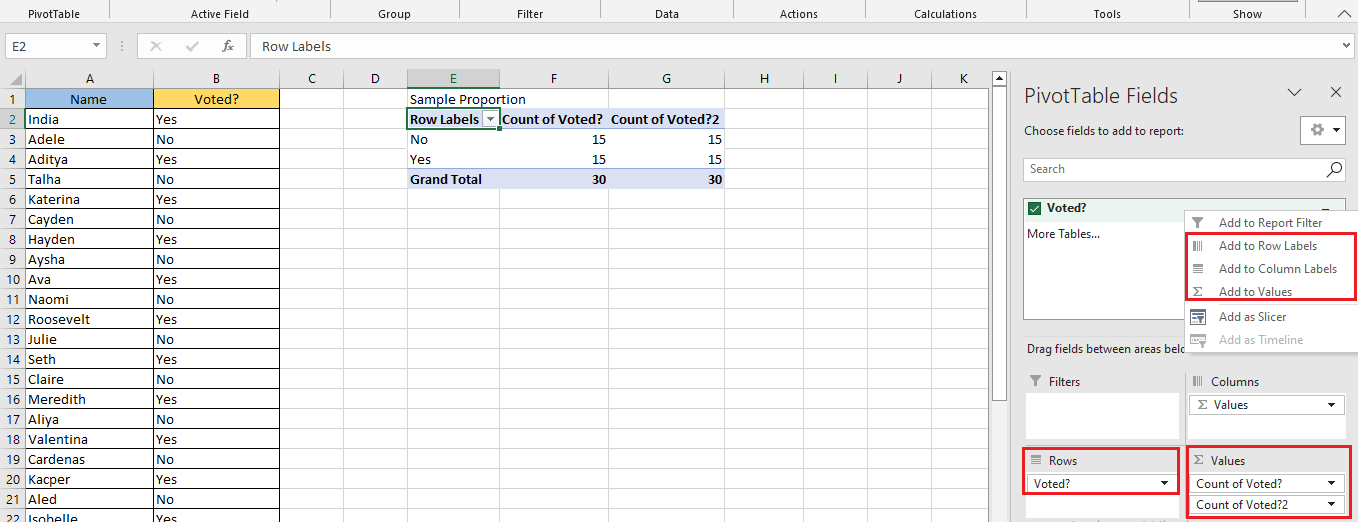
Get the sample proportion by selecting your data, navigating to the Insert tab, and clicking PivotTable in the Tables group.
-
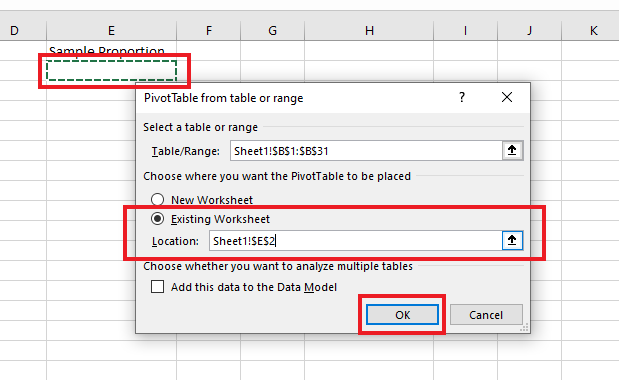
Select a cell and a sheet where you want to put your pivot table and click "OK."
-
Drag "Voted" to the "Rows" field, then drag it twice more into the "Values" field.
-
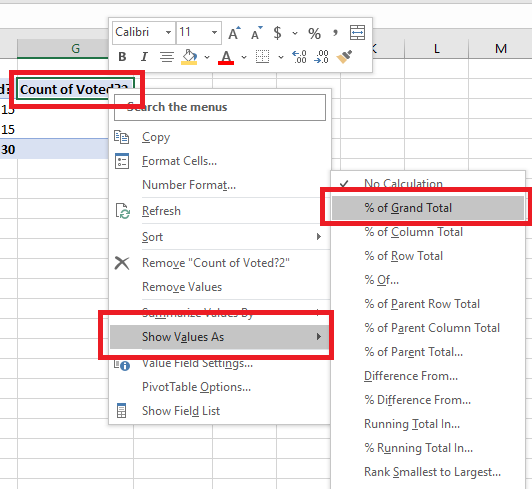
Right-click the third column of the pivot table, choose "Show Values As", then select "% of Grand Total". That percentage is your sample proportion p.
-
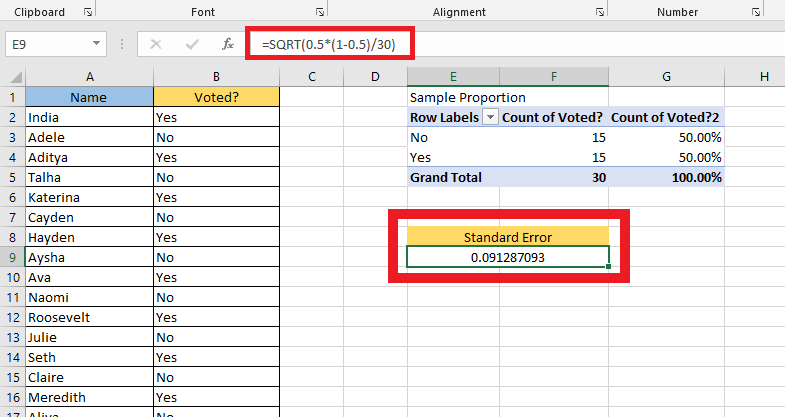
Calculate the standard error of the proportion with =SQRT(D1*(1-D1)/D2), where D1 is p as a decimal and D2 is the total number of responses.
-
Get the z value with =NORM.S.INV(0.975) for 95 percent confidence.
-
Multiply the standard error by the z value. That product is your margin of error.
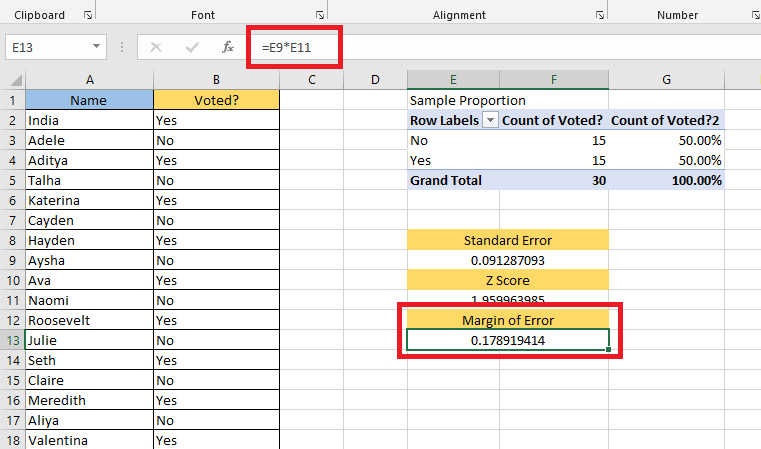
-
Add and subtract it from p to state the confidence interval.
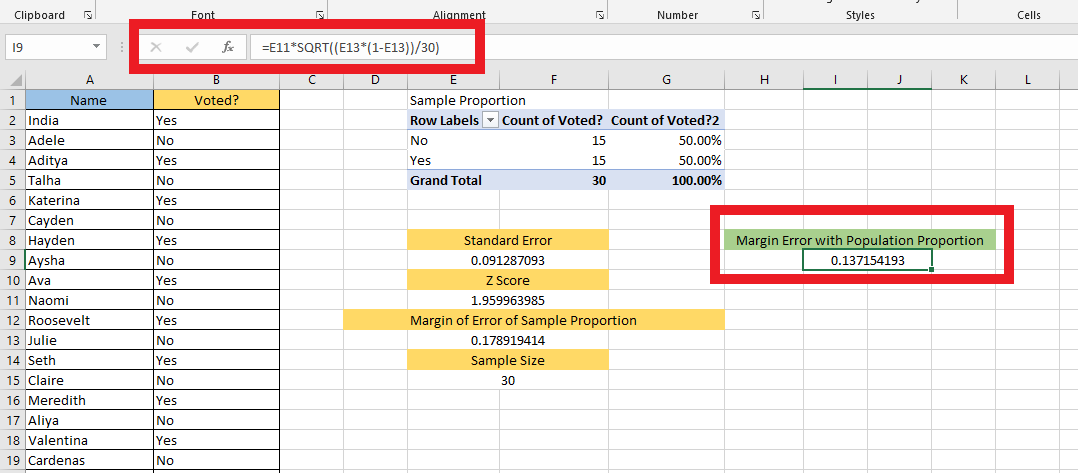
In this worked example the margin of error with population proportion is 0.137, or 13.7 percentage points, which is large because the sample is small. That is the honest result, not a mistake.
One thing worth knowing: p times (1 minus p) is at its maximum when p is 0.5. That is why pollsters quote a single margin of error for a whole survey: they compute the worst case at 50 percent, and every other question in the survey comes out narrower.
How to find the margin of error from a confidence interval
If someone hands you an interval rather than raw data, you do not need any of the above. The margin of error is half the width:
margin of error = (upper limit - lower limit) / 2
In Excel, with the lower limit in A2 and the upper limit in B2:
=(B2-A2)/2
And the sample estimate itself is the midpoint, =(A2+B2)/2. A published interval of 47 percent to 57 percent therefore means an estimate of 52 percent with a margin of error of 5 percentage points.
The rule: a symmetric confidence interval is always the estimate plus or minus the margin of error, so you can always convert between the two with nothing more than subtraction and division.
How does sample size change the margin of error?
The square root of n in the denominator is the whole story, and it is the reason surveys get expensive.
The rule: to halve your margin of error you have to quadruple your sample. Going from 100 respondents to 400 cuts the margin of error in half. Going from 400 to 800 only shrinks it by about 29 percent.
The same arithmetic works in reverse if you are planning a survey. To hit a target margin of error E on a percentage at 95 percent confidence, the worst-case sample size is:
=CEILING.MATH((1.96^2*0.25)/D1^2), where D1 holds your target margin of error as a decimal.
At a target of 0.05 that returns 385, which is where the familiar "about 400 people" figure in survey design comes from.
Z values by confidence level
| Confidence level | Alpha (for CONFIDENCE.NORM) | Excel formula for z | z value |
|---|---|---|---|
| 80% | 0.20 | =NORM.S.INV(0.90) | 1.2816 |
| 90% | 0.10 | =NORM.S.INV(0.95) | 1.6449 |
| 95% | 0.05 | =NORM.S.INV(0.975) | 1.9600 |
| 98% | 0.02 | =NORM.S.INV(0.99) | 2.3263 |
| 99% | 0.01 | =NORM.S.INV(0.995) | 2.5758 |
Read the pattern in that last column. Higher confidence means a bigger z, which means a wider margin of error. More certainty costs precision. That trade-off is the reason 95 percent is the default: it is a compromise, not a law.
Why is your margin of error wrong?
| Symptom | Cause | Fix |
|---|---|---|
| The answer is far too large | You used the standard deviation where the formula wanted the standard error, so you skipped the divide by the square root of n | Divide by SQRT(COUNT(range)) first, or use CONFIDENCE.NORM which handles it |
| #NUM! from CONFIDENCE.NORM or CONFIDENCE.T | The standard deviation argument is zero or negative, or the size argument is below 1 | Check the range reference. A standard deviation of zero means every value is identical |
| #NUM! from NORM.S.INV | You passed a probability of 0 or 1, or a value outside that range | Pass 0.975 for 95 percent, not 0.95 and not 95 |
| Your z comes out as 1.645 instead of 1.96 | You used NORM.S.INV(0.95), which is the one-tailed value | A margin of error is two-tailed. Use NORM.S.INV(0.975) |
| The sample size looks too big | COUNTA counts text and headers. COUNT only counts numbers | Use COUNT for numeric data and exclude the header row |
| The result is a tiny decimal like 0.05 when you expected a percentage | Nothing is wrong. A proportion margin of error is a decimal | Format the cell as a percentage, or multiply by 100 |
| Small sample and the answer feels too confident | CONFIDENCE.NORM assumes the population standard deviation is known | Under about 30 observations use CONFIDENCE.T instead |
| STDEV.P and STDEV.S give different answers | They are meant to. STDEV.P divides by n, STDEV.S divides by n minus 1 | Use STDEV.S unless your rows really are the entire population |
Final Thoughts on How to Calculate Margin of Error in Excel
Two formulas cover almost every case. For an average, =CONFIDENCE.NORM(0.05, STDEV.S(range), COUNT(range)). For a percentage, =NORM.S.INV(0.975)*SQRT(p*(1-p)/n). Everything else on this page is either the long way round to those two answers, or a way of reading one when someone hands you an interval instead of data.
The one idea worth keeping: the margin of error is half the width of a confidence interval, and it shrinks with the square root of your sample size, not with the sample size itself.
For more easy-to-follow Excel guides, visit Simple Sheets. Get Excel and Google Sheets templates by reading the related articles below!
Frequently Asked Questions on How to Calculate the Margin of Error in Excel
What is the Excel formula for margin of error?
For an average, use =CONFIDENCE.NORM(0.05, STDEV.S(A2:A101), COUNT(A2:A101)). Written the long way it is z times the standard deviation divided by the square root of the sample size, which in Excel is =NORM.S.INV(0.975)*(STDEV.S(A2:A101)/SQRT(COUNT(A2:A101))). Both return the same number.
Is the margin of error the same as the standard deviation?
No, and it is not the same as the standard error either. The standard deviation measures how spread out your individual data points are. The standard error is the standard deviation divided by the square root of the sample size. The margin of error is the standard error multiplied by a critical value such as 1.96. Each one is a step further along than the last.
Is the confidence level the same as the margin of error?
No, but they move together. Raising the confidence level raises the critical value, which makes the margin of error wider. At the same sample size, 99 percent confidence gives a wider margin of error than 95 percent, and 90 percent gives a narrower one. More certainty always costs precision.
How do I find the margin of error from a confidence interval?
Take the upper limit minus the lower limit and divide by 2. In Excel that is =(B2-A2)/2. The midpoint, =(A2+B2)/2, is the estimate itself. An interval of 47 to 57 percent is an estimate of 52 percent with a margin of error of 5 points.
I get a 10% margin of error, is this acceptable?
It depends entirely on the decision you are making, not on a fixed threshold. A 10 point margin of error usually means the sample is small: at 95 percent confidence on a percentage, roughly 100 responses gives about 10 points and roughly 400 gives about 5. If a 10 point range still points to the same decision, it is fine. If the decision flips somewhere inside that range, collect more responses.
What is the difference between CONFIDENCE.NORM and CONFIDENCE.T?
CONFIDENCE.NORM assumes the population standard deviation is known and uses the normal distribution. CONFIDENCE.T uses the t distribution, which is the right choice when you are estimating the standard deviation from the sample. Below about 30 observations the difference is worth having, and CONFIDENCE.T gives the wider answer.
Why does NORM.S.INV use 0.975 for a 95 percent confidence level?
Because a margin of error is two-tailed. Ninety-five percent confidence leaves 5 percent outside the interval, split evenly, so 2.5 percent sits in each tail. NORM.S.INV takes a cumulative probability, and 1 minus 0.025 is 0.975. Passing 0.95 instead returns 1.645, which is the one-tailed value and will make your margin of error too narrow.
Related Reading
How to Calculate Standard Error in Excel
How to Calculate a Confidence Interval in Excel
Scatter Plot in Excel (In Easy Steps)
Related Templates:
Want to Make Excel Work for You? Try out 5 Amazing Excel Templates & 5 Unique Lessons
We hate SPAM. We will never sell your information, for any reason.