
How to Calculate Confidence Interval in Excel: Easy to Follow Steps
Jul 26, 2022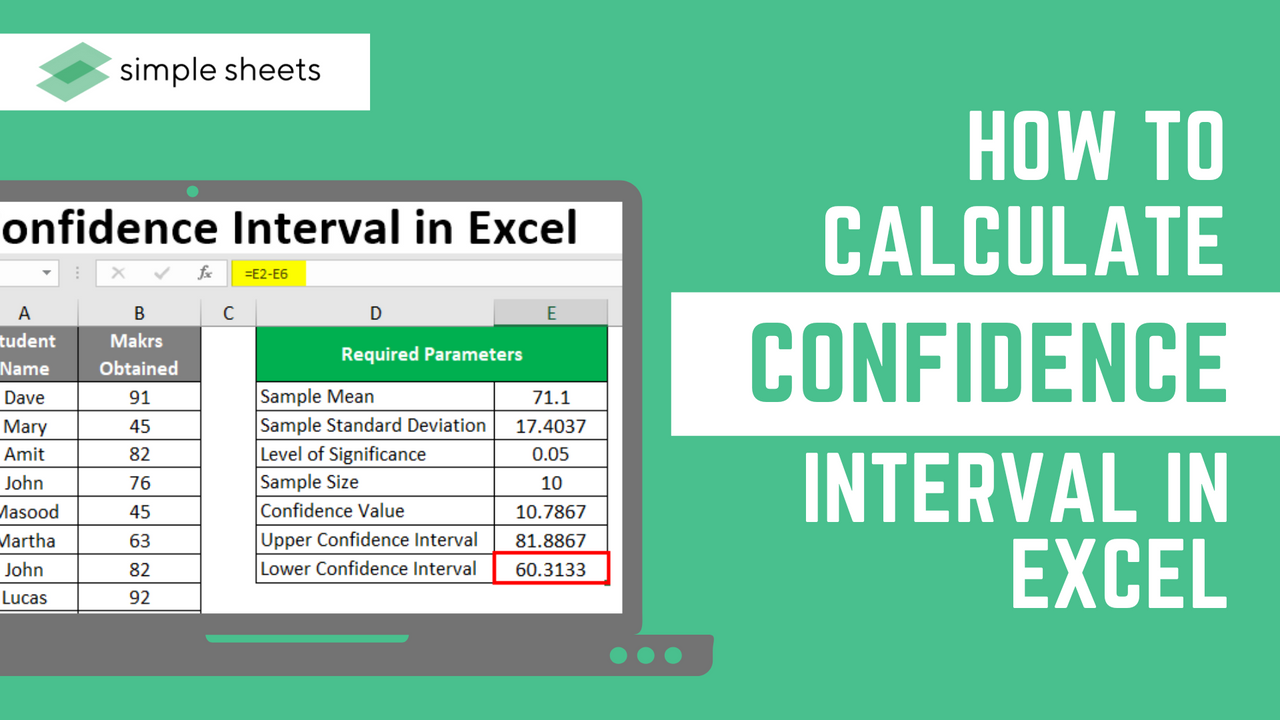
A confidence interval in Excel is calculated using the confidence function. If you are a statistician or financial analyst, you will know how important it is to calculate the confidence interval within Excel. You will also know that learning the margin of error for a sample mean allows for optimal statistical surveys.
This article will discuss the confidence interval in detail and how it is used for data analysis within Excel. But, learning how to calculate confidence intervals in Excel is very important. 
What Is a Confidence Interval in Excel?
A confidence interval in Excel defines a range of values in the center due to the sample mean's location. The confidence interval within Excel comes from the confidence value statistic. The confidence function within Excel offers a value used to create a confidence interval for a sample mean. In Excel, the mean value tends to derive from a normal distribution, standard deviation, and sigma. 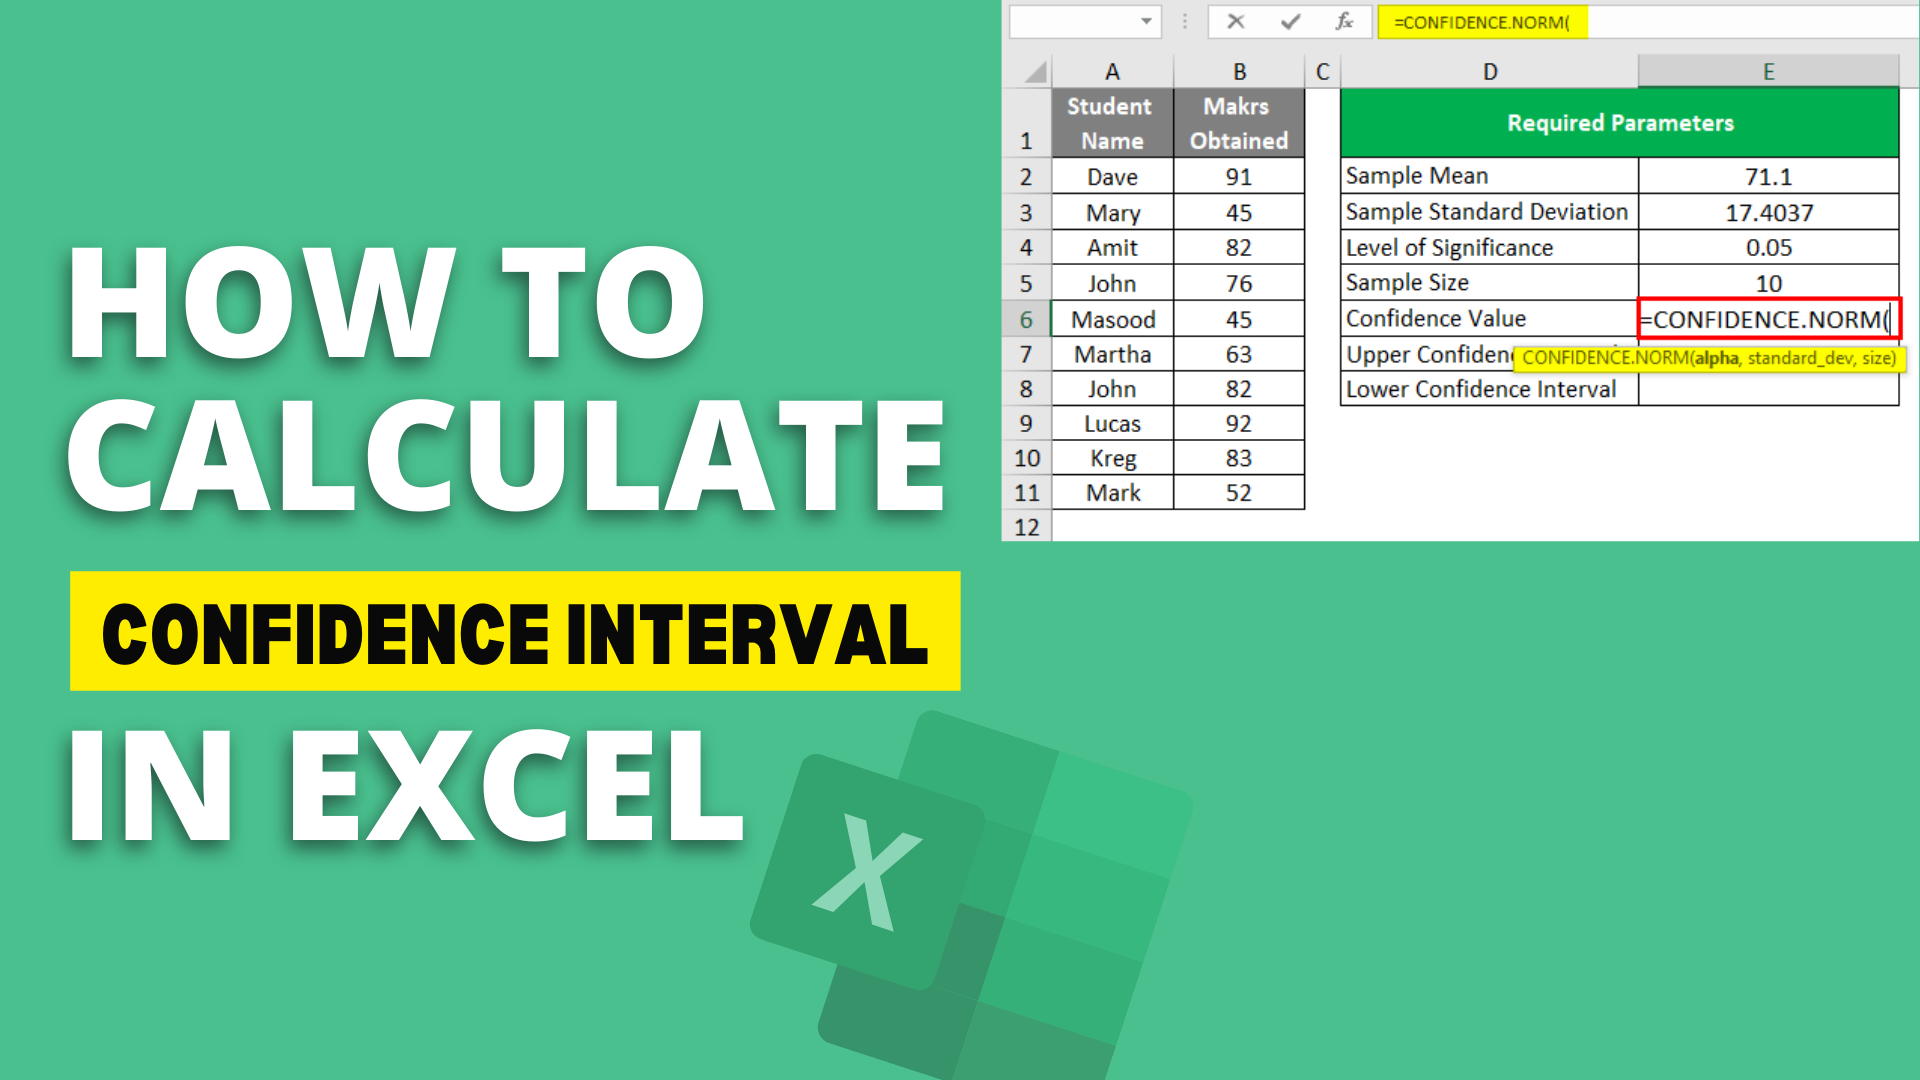
Why Learn How to Calculate a Confidence Interval in Excel?
Excel is perfect for statistical computations.
To execute financial and statistical analysis, Excel is the most-used application globally. It is quick to navigate and easy to add statistical functions to projects. Also, Excel offers standard error notifications to let users lower the margin of error.
Excel is a highly used statistical analysis tool.
Many people rely on Excel for statistical computations. Excel is often seen as the go-to statistical computation. Becoming skilled in Excel allows you to complete many jobs and requirements.
It is easy to find learning resources.
Due to its popularity, Excel offers quick and easy ways for beginners to learn and improve their skills.
How to Calculate a Confidence Interval in Excel: A Step-By-Step Guide
Review the Confidence Function in Your Excel Version.
Firstly, it is essential to note that if you use a newer version of Excel, you will not see the confidence function within the list of statistical functions. Instead, it has gotten replaced by CONFIDENCE.NORM and the CONFIDENCE.T functions within Excel. These two new functions offer better accuracy, so they took their place. For this example, I will use CONFIDENCE.NORM function to work out the confidence interval of our sample mean. 
Review Your Query.
Now that is out of the way, let's get started! Let's start by assuming the raw test scores from a school offering the below distribution. 38, 15, 14, 22, 24, 21, 18, 12, 13, 14, 30, 25, 20, 15, and 19. We must first establish your confidence interval to determine the standard deviation and mean. From there, you need to input your significance level.
Calculate the Sample Mean.
From there, open your Excel worksheet, and build a column called "Student distribution." Select a blank cell and input the range of values highlighted above. These values should cover all the cells from A2 to A16.  Then, select "fx" from the function tab to choose the mean function. In Excel, this is written as =AVERAGE(). Place your cell reference into the columns so your formula looks like this: =AVERAGE(A2:A16). Hit the enter button, and you should see the score of 20 appear.
Calculate the Standard Deviation.
You can now highlight the 17th row to ensure it is easier to see this critical information. Next, create a new column using the header "standard deviation." To work out your sample standard deviation, press the "fx" button. From statistical functions, choose =STDEV.P(). Input the values into cells within column B so the formula looks like this: =STDEV.P(A2:A16). Select the enter key to see 6.87992. 
Find the Significance Level and Alpha Value.
Okay, let's assume that our significance level is 95%. In most instances, the significance level ranges from 90 to 99%. The alpha value is the probability value used to determine whether a statistical test is error-free. To identify the value, solve 1 - alpha, one minus 0.95.
Calculate the Confidence Value.
We need to create a third column called "confidence value." This column will contain our population sample size, the standard deviation, and the alpha value. To work out the confidence rate, implement this formula: =CONFIDENCE.NORM(alpha,standard_dev,size).
Calculate the Interval of Confidence.
Don't forget that the confidence interval refers to the range of cells with the sample means in the center. To establish the accurate computation of our confidence level, we must subtract our confidence value from the sample mean and include the confidence value to increase our confidence limit.
How to Calculate a Confidence Interval in Excel at Once
Knowing your standard deviation, alpha value, and sample mean value, you can calculate your confidence interval directly in Excel using the Excel confidence function. However, you must have all the components, so ensure that the data range you enter into the confidence interval formula is right, to get an accurate confidence interval.
Benefits of Calculating a Confidence Interval in Excel
Excel offers a more simplified process.
Unlike an intermediate workbook, you have the power to build a concise statistical computation within an Excel sheet. Excel offers features that ensure building statistical models is extremely simple.
It is time-saving.
Discovering statistical functions and calculating Excel values is easy once you start. You can save much time on computing complex data, as Excel does automatically, so long as you input the correct values.
Microsoft Excel is accessible.
One simple factor that ensures Excel is good is because of how accessible it is. You can access Excel for an affordable yearly cost and use it to complete many tasks. 
Related Articles:
How to Delete Sheets in Excel: Deleting Multiple Sheets at Once
Want to Make Excel Work for You? Try out 5 Amazing Excel Templates & 5 Unique Lessons
We hate SPAM. We will never sell your information, for any reason.

