
Burndown Chart
Excel Template
🎯 Best Value: This template + 30 more
Get this plus 30+ Project Management templates for just $99.
Get the Project Management Bundle — $99— OR continue with just this template below —
What's Inside the Burndown Chart Template?
Details | 2 Sheets
Supported Versions (All Features) | Excel 2016, 2019, Office 365 (Mac)
Supported Versions (Significant Features) | Excel 2010, 2013, 2016, 2019, Office 365 (Mac)
Category | Project Management
Tags | Agile, Scrum, Tasks

Why Professionals Choose Simple Sheets
It's simple. Access to the largest library of premium Excel Templates, plus world-class training.

100+ Professional Excel Templates
Optimized for use with Excel. Solve Excel problems in minutes, not hours.

World-Class Excel University
With our university, you'll learn how we make templates & how to make your own.

How-To Videos
Each template comes with a guide to use it along with how-to videos that show how it works.
Inside Our Burndown Chart Excel Template
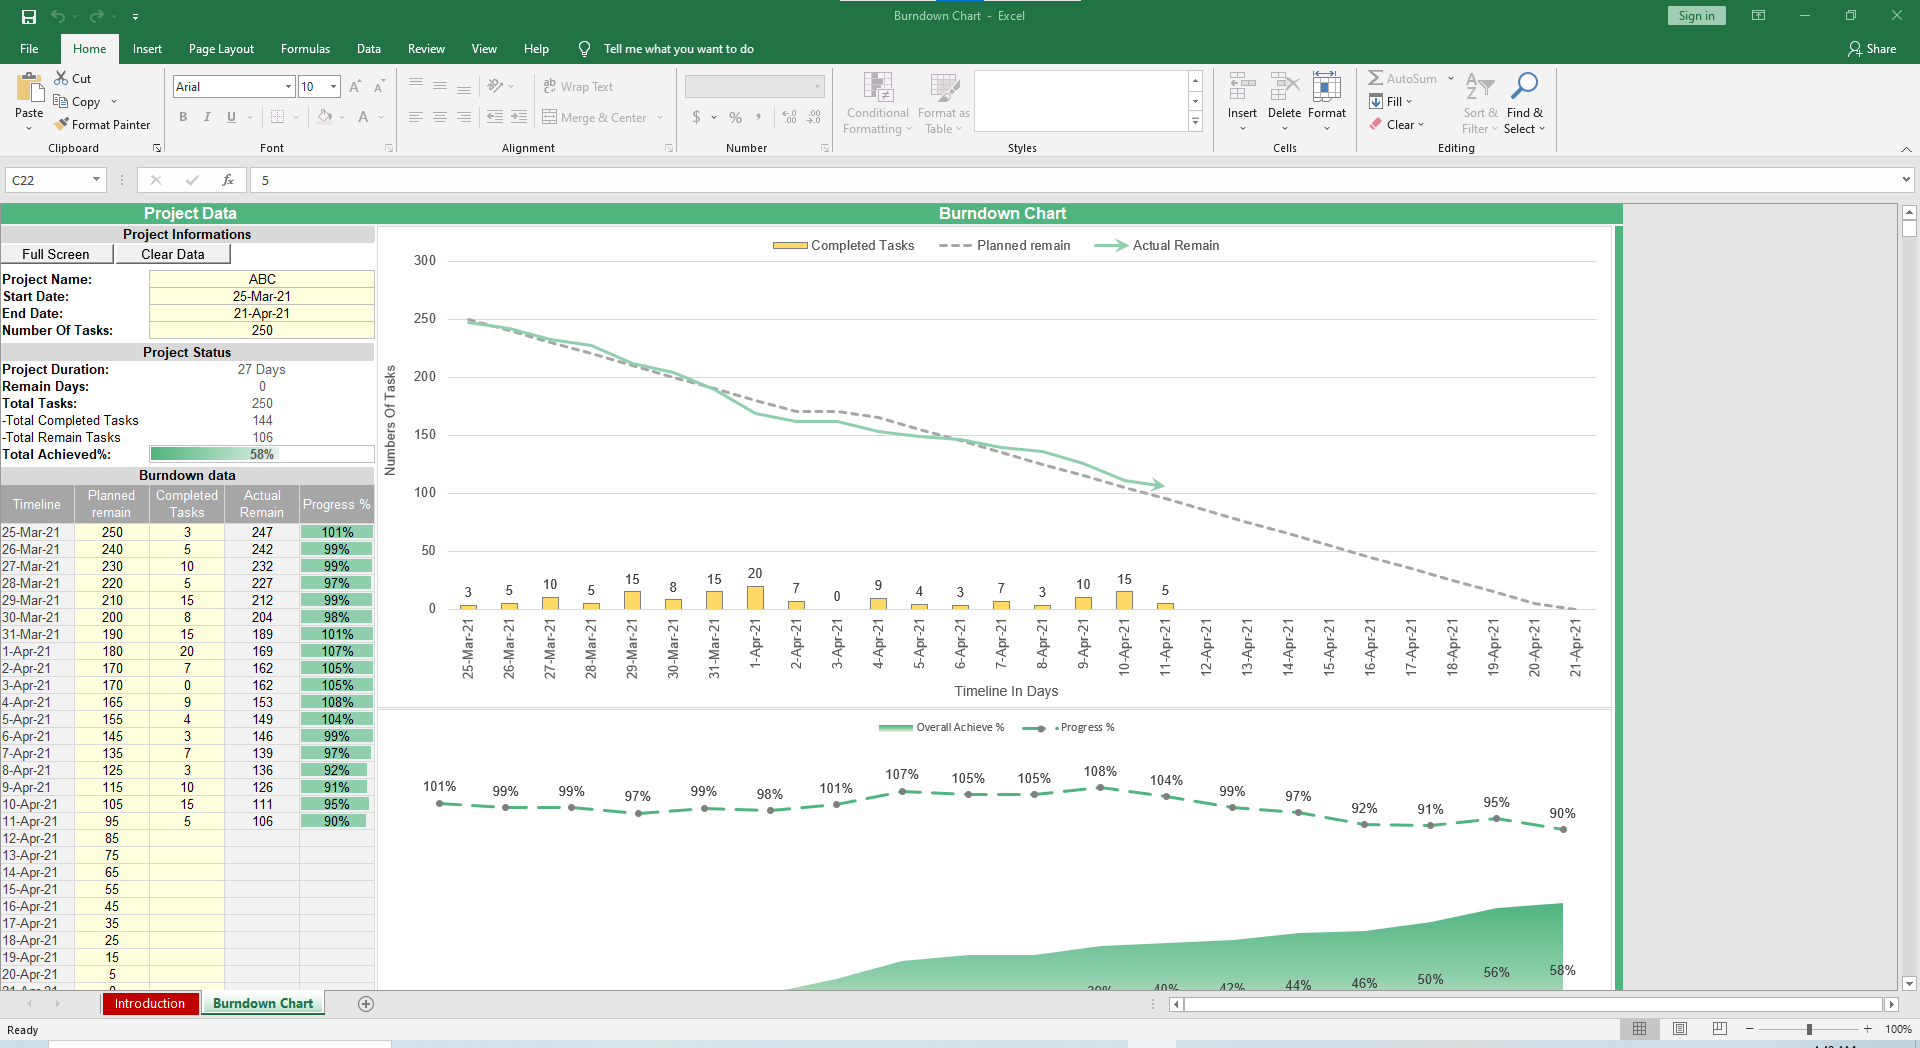
A burndown chart is a simple visual that shows the amount of work remaining compared to the available time. It is widely used in project management and agile workflows because it makes progress easy to understand.
The chart plots time along one axis and work remaining along the other, creating a line that “burns down” as tasks are completed.
This makes it easy to spot delays and forecast completion dates. You can use our burndown chart template in Excel instead of building one from scratch.

Why Use Our Burndown Chart Template?
The process of creating a burndown chart in Excel from scratch can be time-consuming and prone to errors. Our ready-made burndown chart Excel template simplifies the process to give you reliable results with minimal effort.
With this template, you can:
- Work faster: No need to build formulas or format charts manually.
- Track progress accurately: See completed vs. remaining work at a glance.
- Support agile teams: Use it as an agile burndown chart Excel template for sprint planning and backlog tracking.
- Spot risks early: Adapt the chart into a risk burndown chart Excel template to visualize issues.
- Stay flexible: From a simple burndown chart Excel template for small projects to complex workflows, it adjusts to your needs.
Features of the Burndown Excel Template
Our burndown chart in Excel template is powerful and user-friendly. We built every detail to help you track progress with minimal effort. Here are the key features you will find:
- Full screen view: Present the chart in a clean layout for team or stakeholder meetings.
- Full customization: Adjust timelines, number of tasks, or reporting style to fit any project size.
- One-click reset: Clear data instantly when starting a new project.
- Clear visual charts: Compare completed tasks, planned progress, and actual remaining work with easy-to-read graphs.
- Automatic status updates: See project duration, remaining days, completed tasks, and overall achievement % calculated instantly.
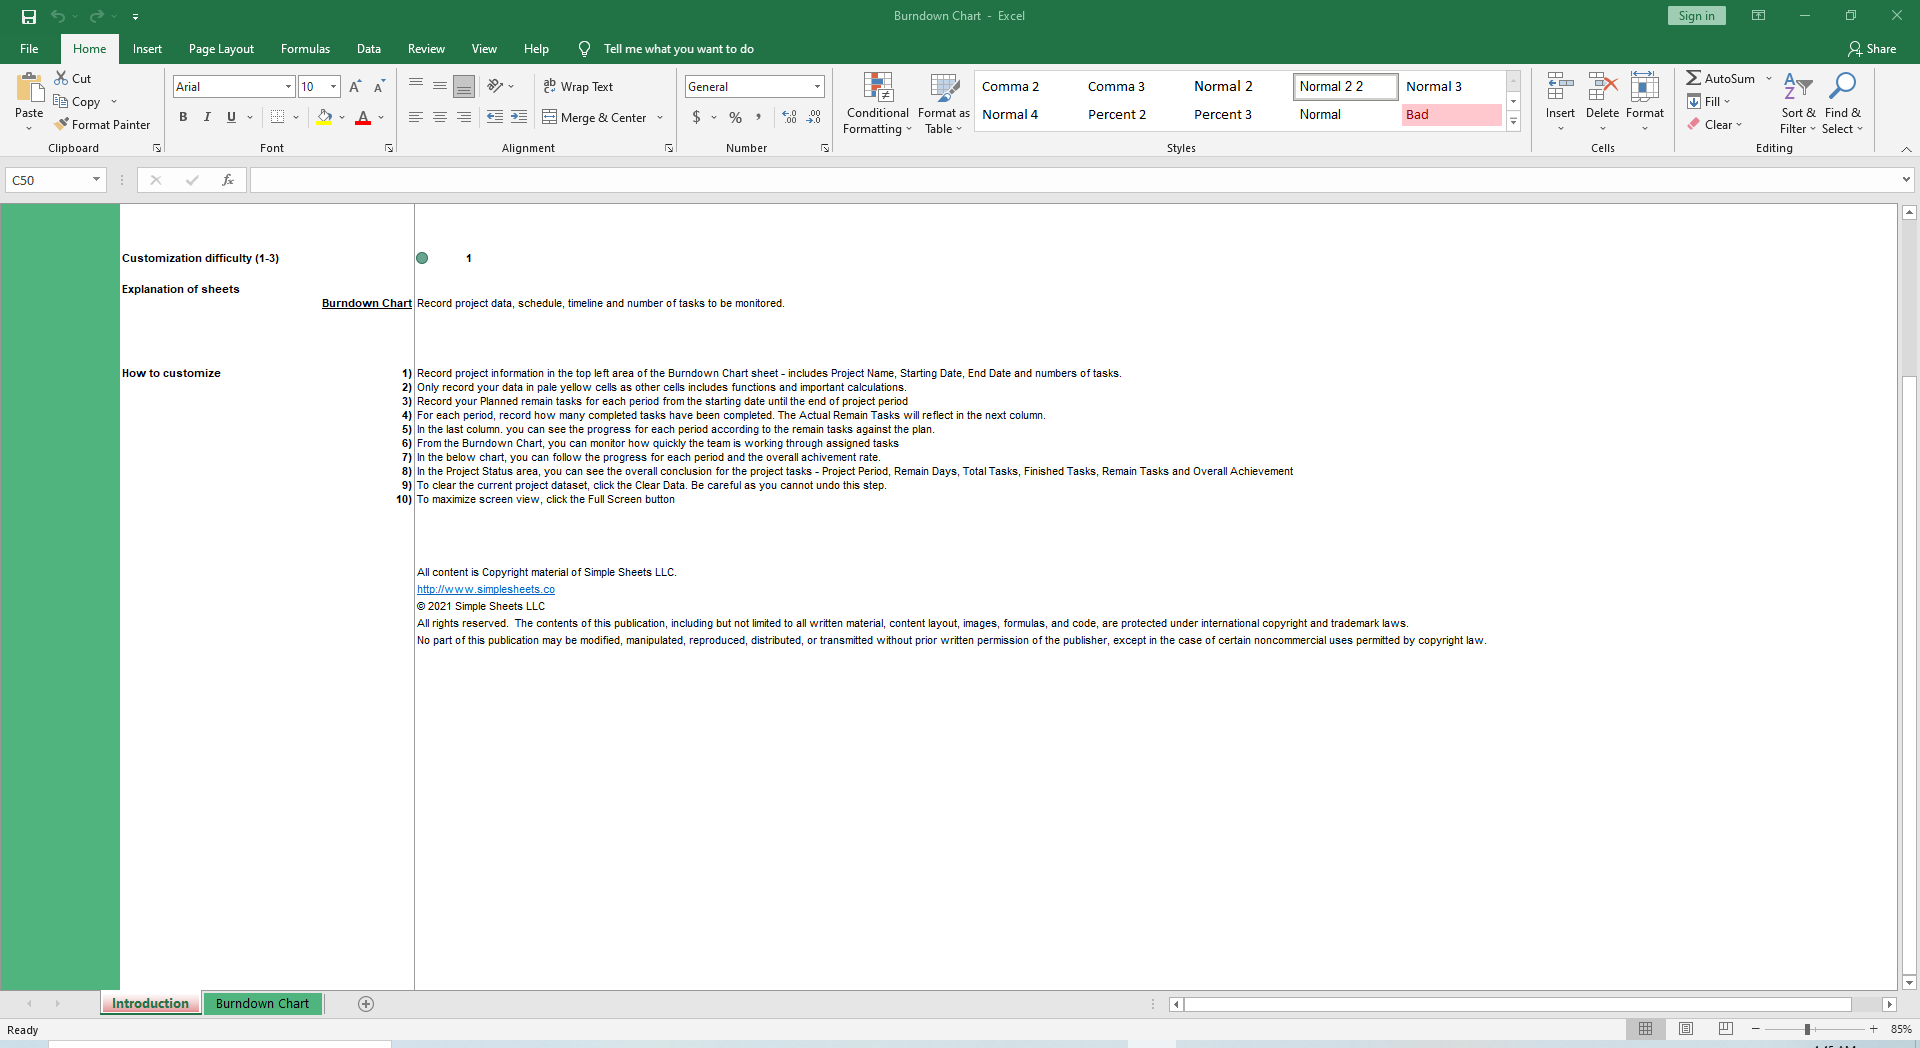
How to Use the Burndown Chart Excel Template
You don’t need any training to use the burndown chart Excel template. The information below is enough to get you started:
- Enter project details: Add your Project Name, Start Date, End Date, and Number of Tasks in the top left area of the sheet.
- Input only in editable cells: Update data in the pale yellow fields. Other cells contain formulas and should not be changed.
- Record planned tasks: List your planned remaining tasks for each period from the project start date until the end date.
- Track completed tasks: For each period, record how many tasks have been finished.
- See actual progress: The “Actual Remain Tasks” column updates automatically to show remaining work against your plan.
- Monitor performance: The burndown chart visualizes how quickly the team is completing tasks over time.
- Reset anytime: Use the Clear Data button to remove old data and start fresh on a new project.
- Go full screen: Switch to full screen mode for a clean, presentation-ready view.
Who Is This Template for?
Our Excel burndown chart template is suitable for anyone who needs a clear view of project progress. It’s a practical tool for:
- Agile teams: Track sprint progress and keep backlogs under control.
- Project managers: Monitor deadlines and ensure work is on pace.
- Team leads: Share simple visuals that keep everyone aligned.
- Small businesses and freelancers: Manage client projects with professional reporting.
- Students and researchers: Organize tasks and track progress for academic projects.
Buy the Burndown Chart Template
Take the stress out of project tracking with our burndown chart Excel template. Instead of spending hours building charts from scratch, you’ll have a ready-made tool that updates automatically as you log your data. Click the link below to get your copy.
[Buy Now]
About Simple Sheets
At Simple Sheets, we believe project management shouldn’t be overwhelming. We create ready-to-use Excel solutions that simplify complex tasks. Every template we design is built to save time and give teams the clarity they need to deliver results.
We also provide dedicated support to ensure that our users make the most of every template. Beyond the burndown chart Excel template, our collection includes templates for Gantt charts, Kanban boards, PDCA frameworks, and earned value analysis.
FAQs
1. What versions of Excel does the burndown chart template work with?
The template is fully compatible with all versions of Microsoft Excel. You don’t need any special add-ins or software.
2. Can I customize the burndown chart Excel template for my project?
You can edit dates, tasks, and data fields to match any project size or style. The chart updates automatically as you make changes.
3. Is this useful for agile project management?
Many teams use it as an agile burndown chart Excel template to track sprint progress and manage backlogs.
More Project Management Templates For You


