
Fishbone Diagram
Excel and Google Sheets Template
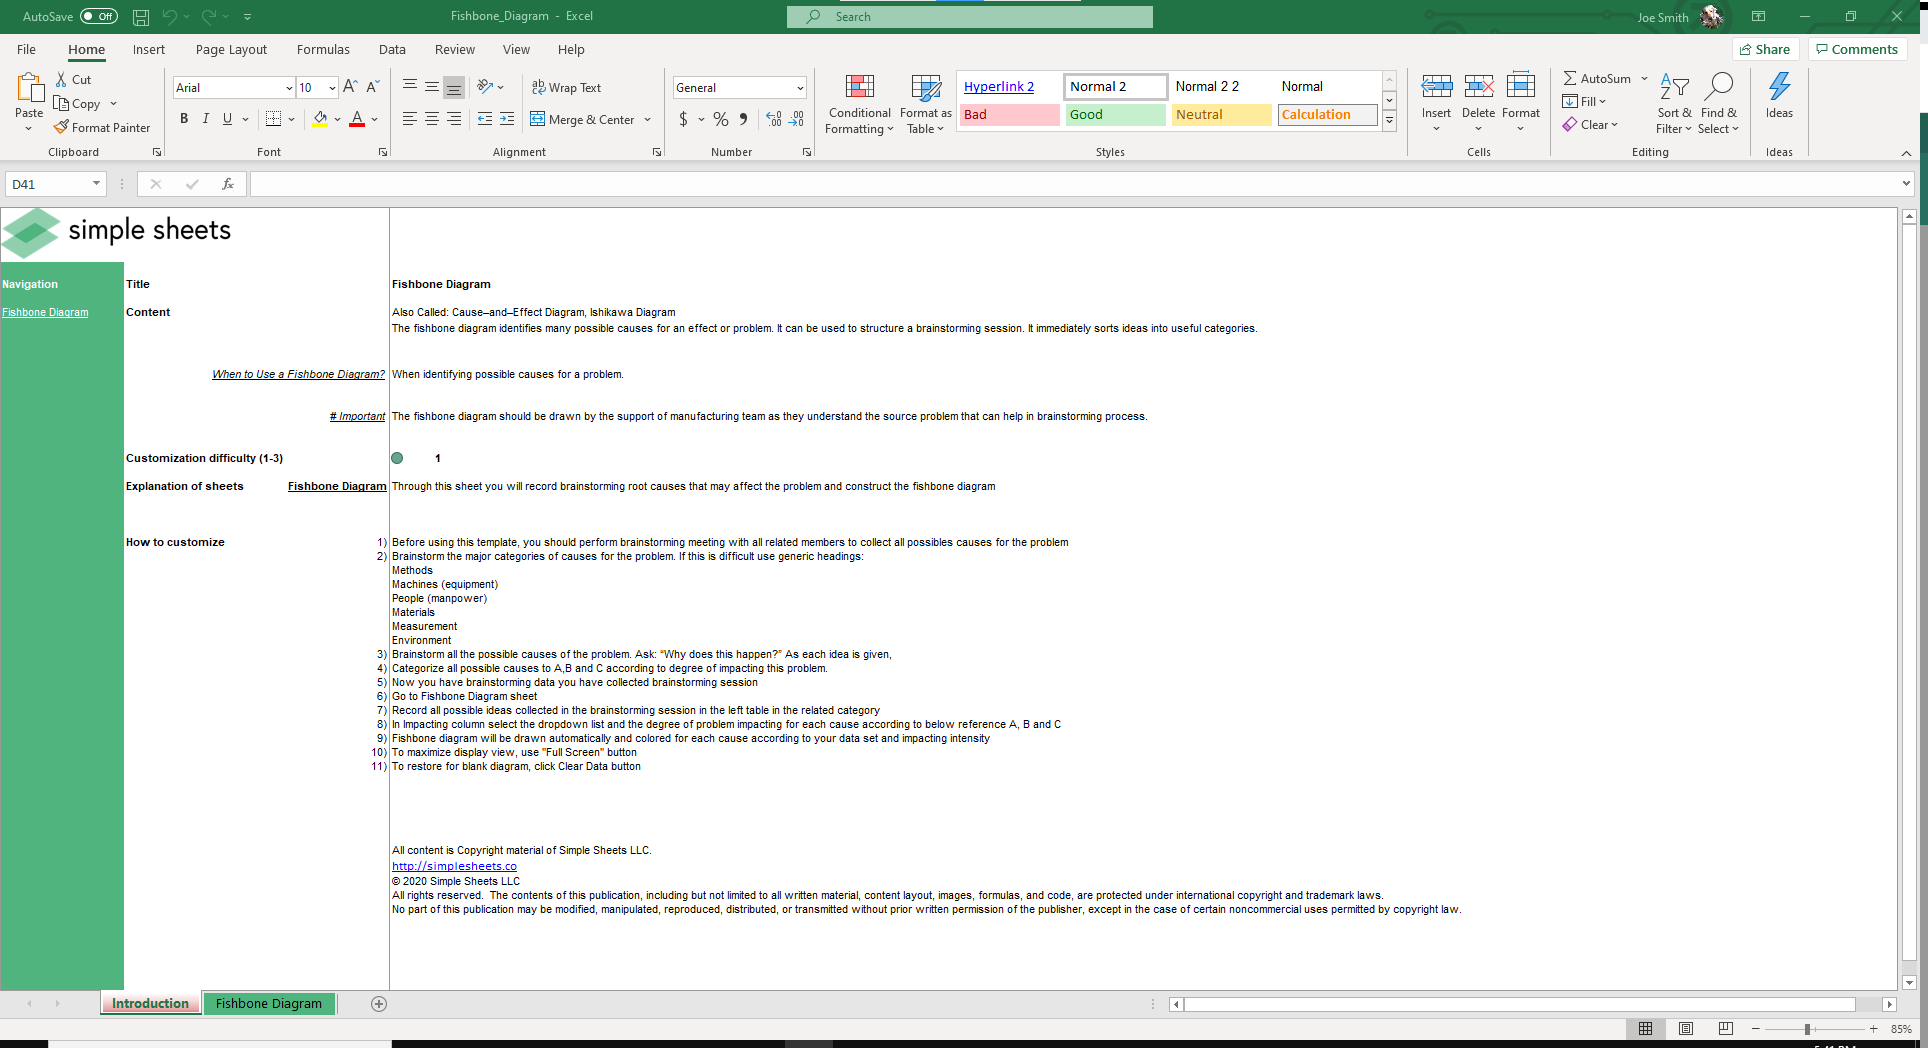
What's Inside the Fishbone Diagram Template?
Details | 2 Sheets
Supported Versions | Excel 2010, 2013, 2016, 2019, Office 365 (Mac), Google Sheets
Category | Supply Chain & Operations, Data Analysis
Tags | Cause and Effect, Ishikawa, 7 Basic Tools of Quality Control
Why Professionals Choose Simple Sheets
It's simple. Access to the largest library of premium Excel Templates, plus world-class training.

100+ Professional Excel Templates
Optimized for use with Excel. Solve Excel problems in minutes, not hours.

World-Class Excel University
With our university, you'll learn how we make templates & how to make your own.

How-To Videos
Each template comes with a guide to use it along with how-to videos that show how it works.
Inside Our Fishbone Diagram
Excel and Google Sheets Template
The Fishbone Diagram is the Shaquille O’Neal of quality control tools.
Not for any other reason than it has about five different names it goes by - Ishikawa, Herringbone, Cause-and-Effect and even Fishikawa. Shaq, the famous basketball player, claimed himself The Big Aristotle, Superman and Diesel to name a few.
Sports aside, the Fishbone Diagram is a process for identifying root causes that contribute to a particular effect. Essentially, it seeks to find a cause and effect relationship to prevent further quality defects.
If you find this template helpful, you’ll also want to check out the other seven basic tools of quality templates in our library such as Check Sheet, Stratification, Pareto Chart and Scatter Diagram. Each of these templates is designed around helping you better identify relationships, reduce defects and improve efficiencies.
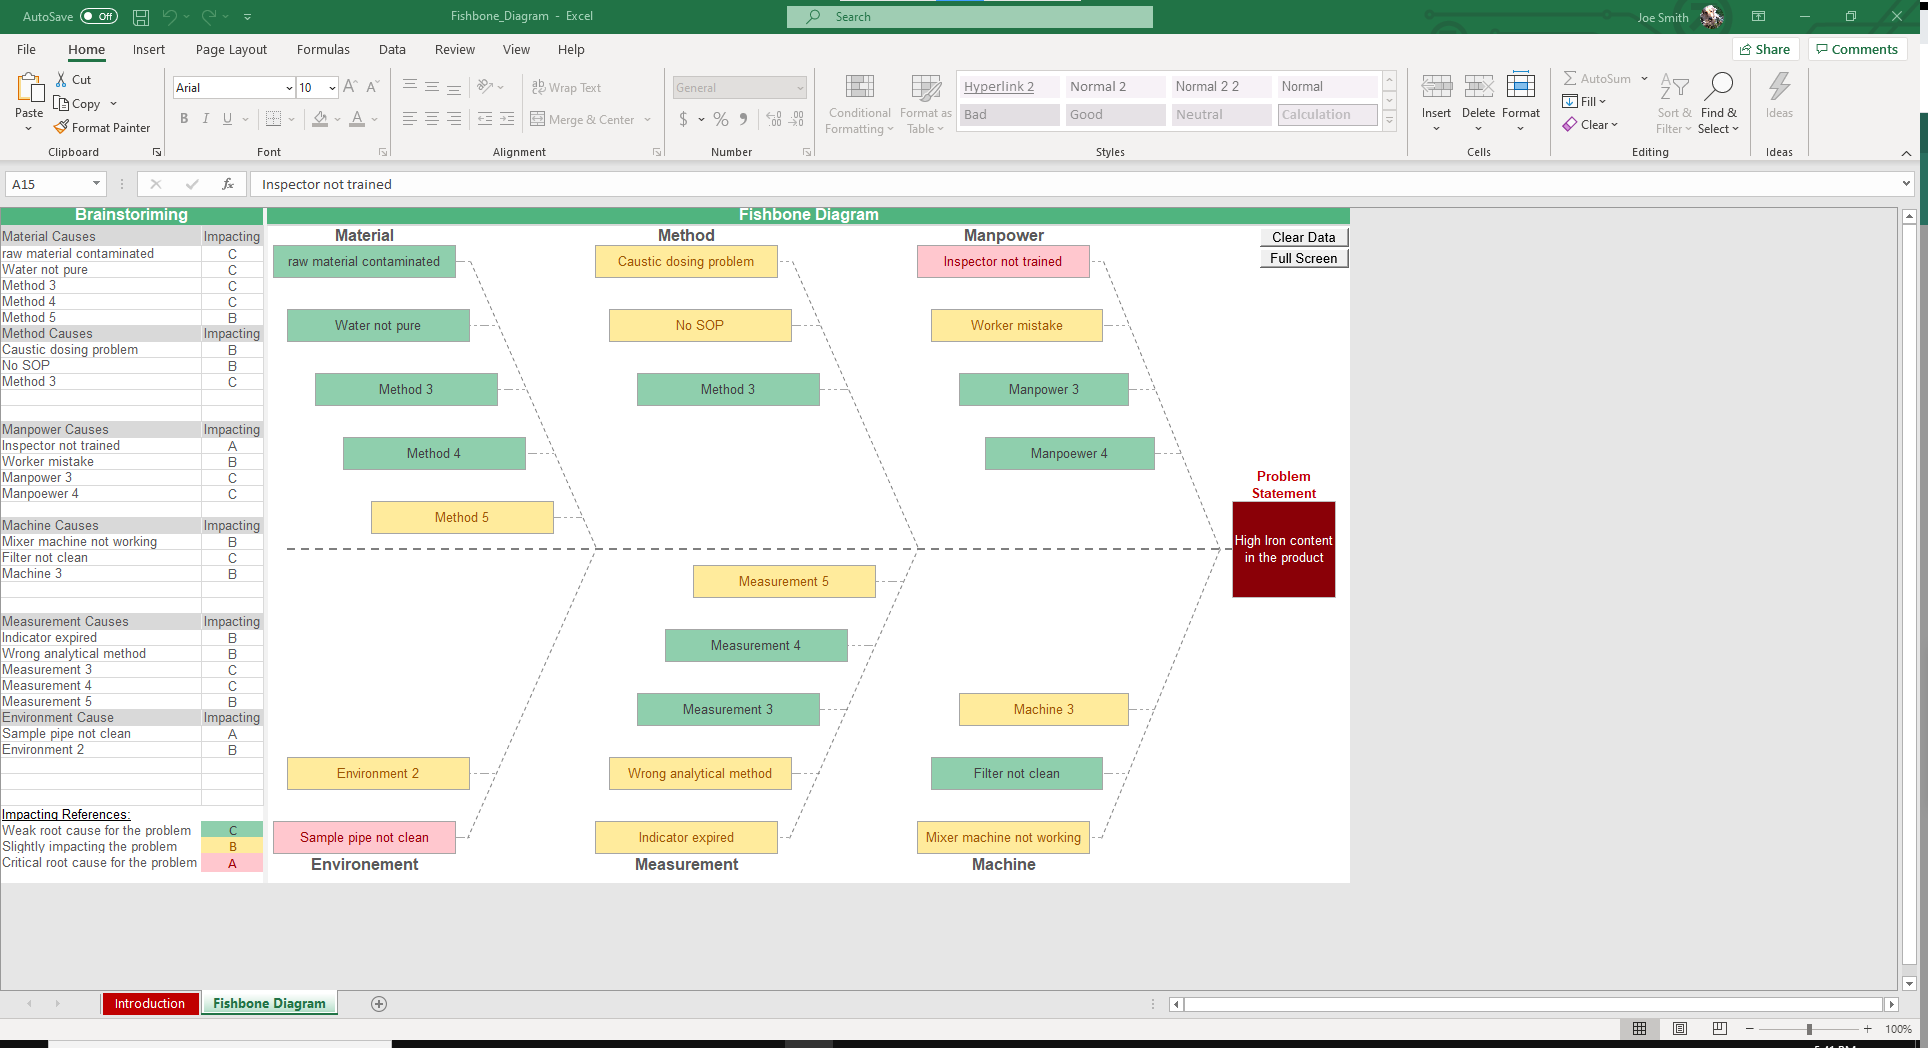
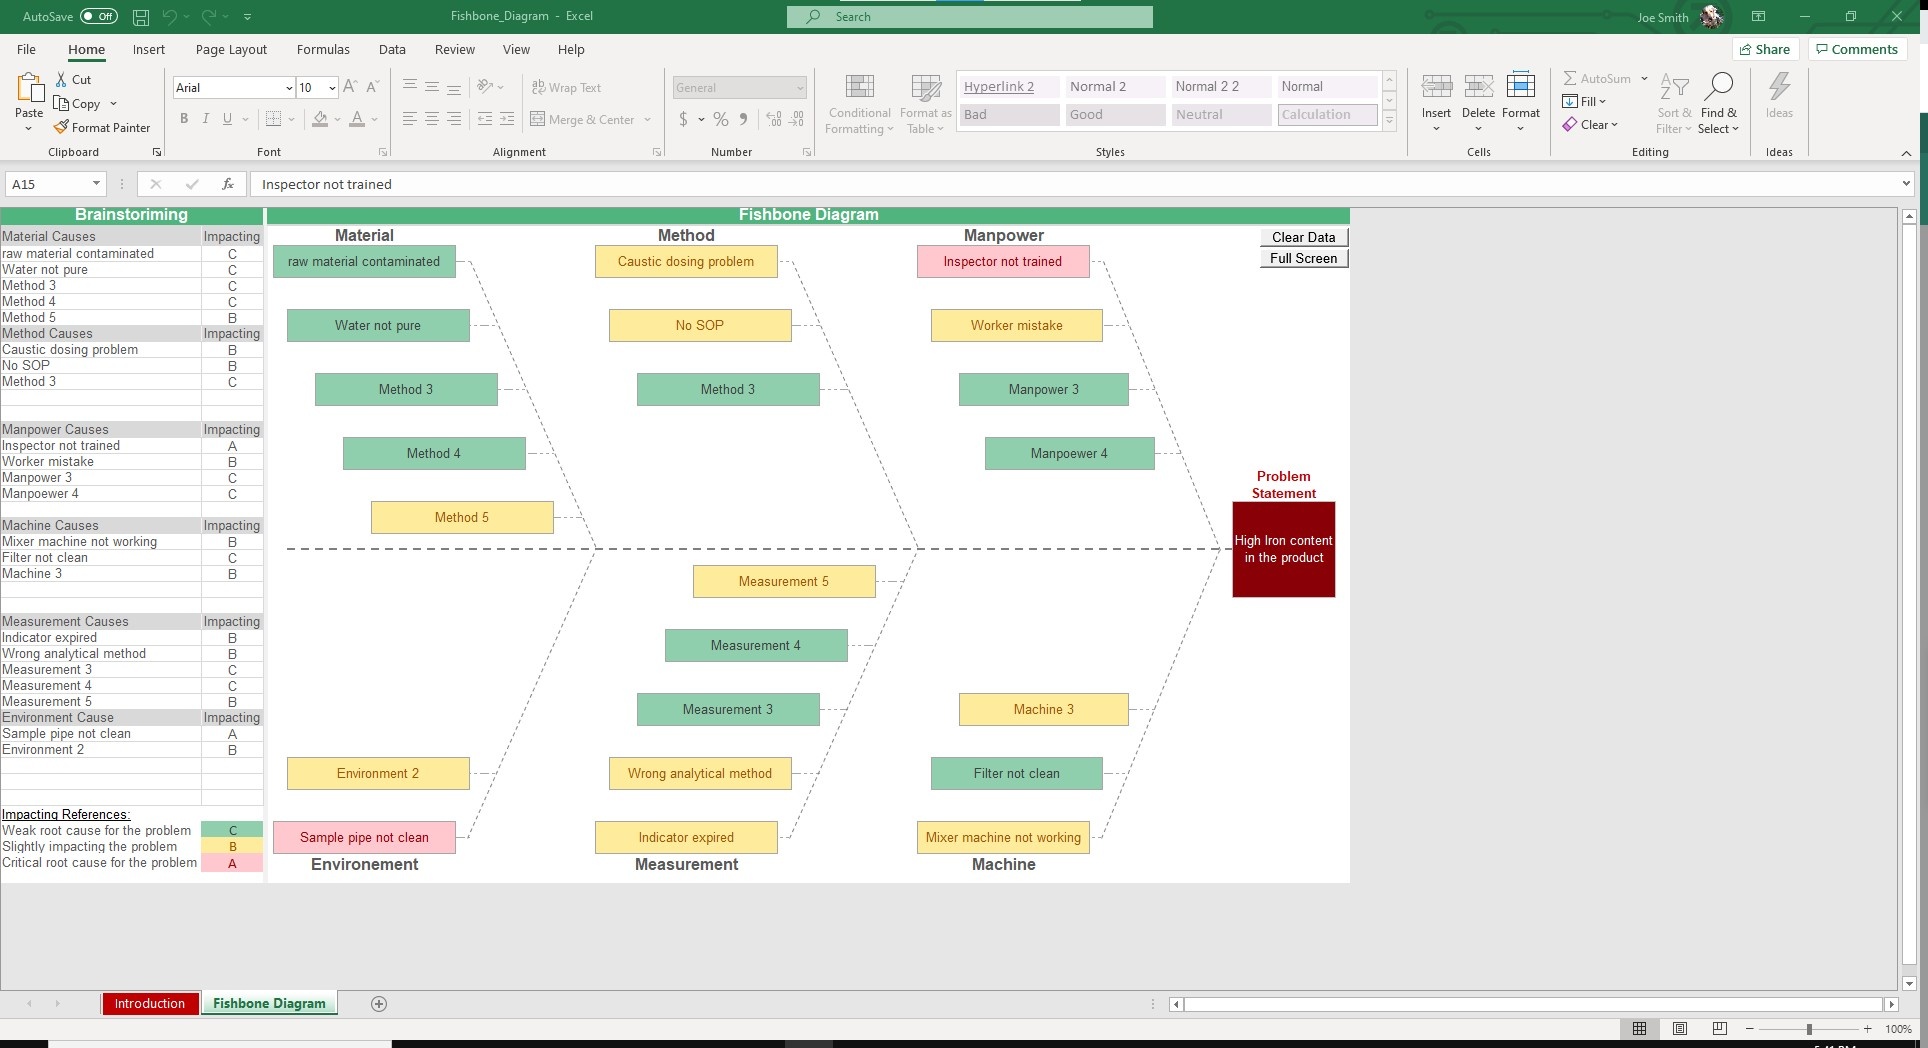
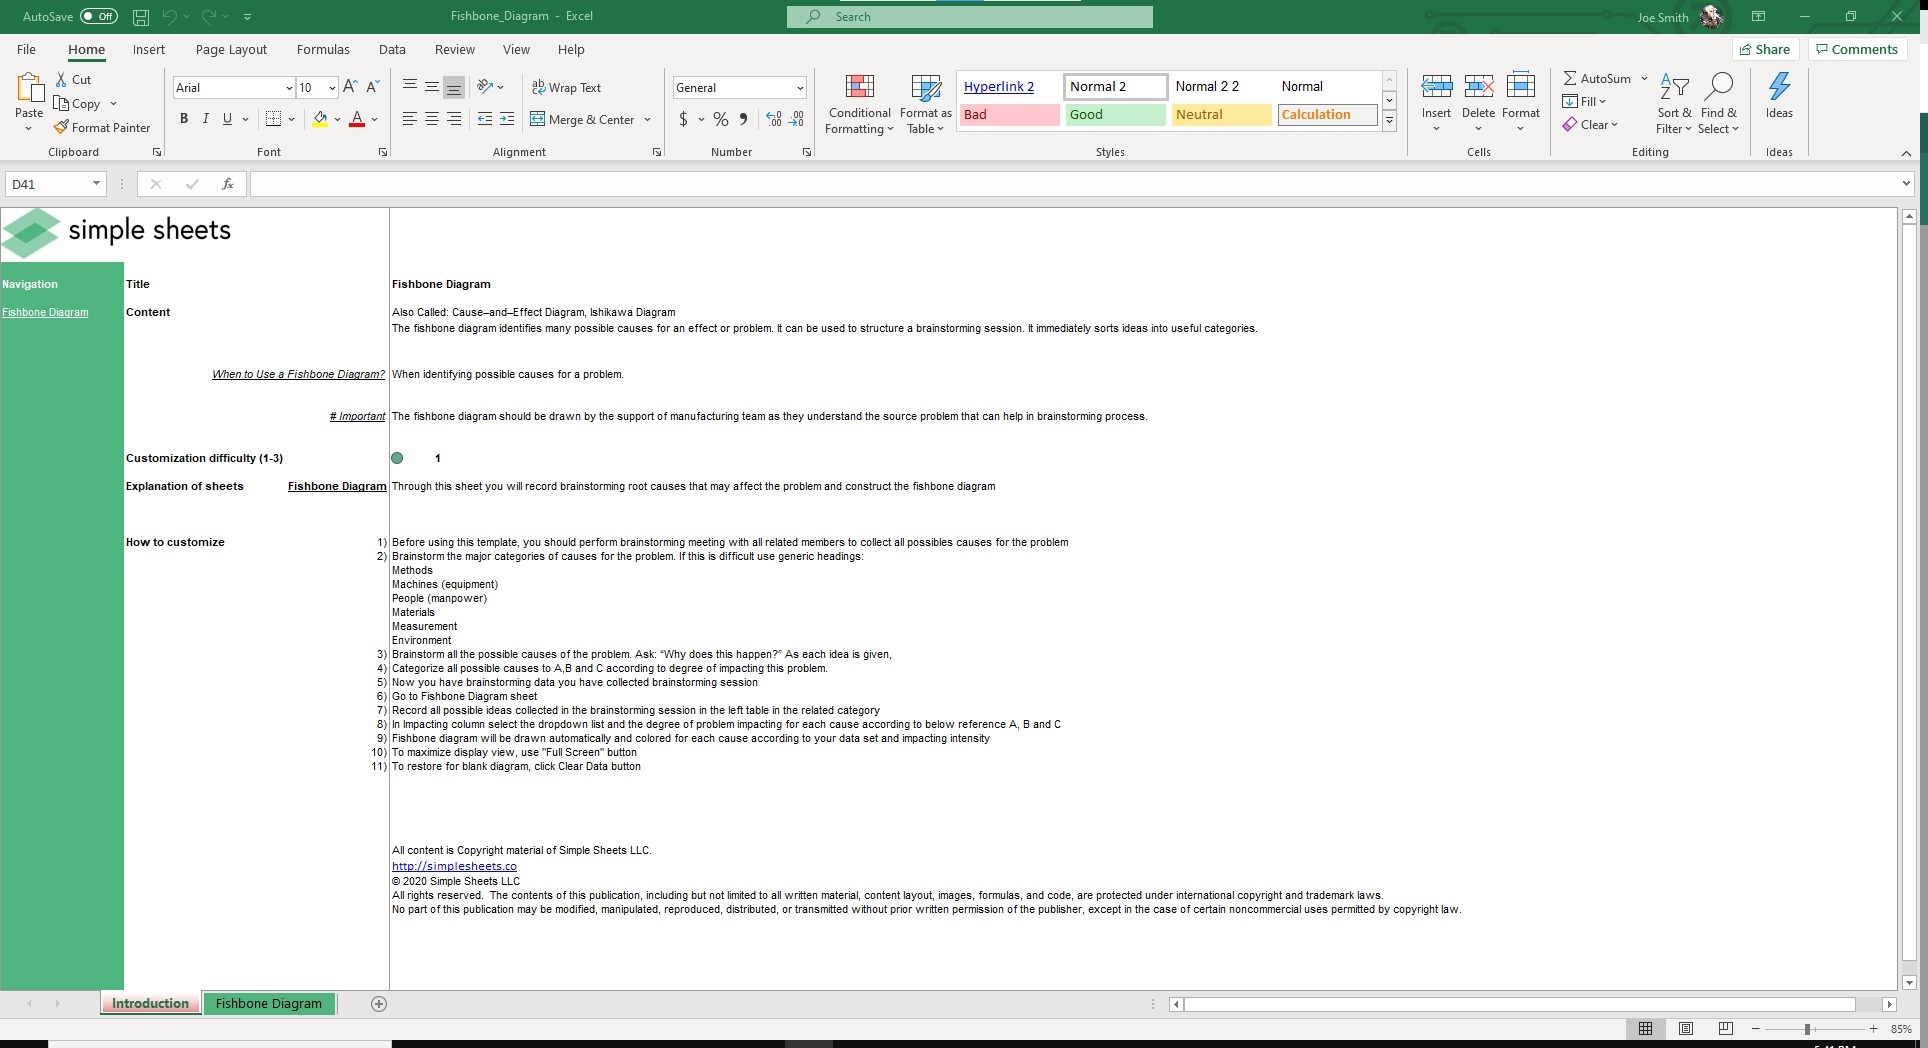
Before diving into this template, the first step is evaluating the 5 Ms: Man, Machine, Materials, Method and Measurement. Assign each issue to one of these categories. Record all issues in the left side of the table according to the category.
In the Impacting column, select the dropdown list and the degree of the problem for each reference according to A, B and C.
The Fishbone Diagram will auto populate according to your inputs with conditional formatting that highlights the most intense contributing factors.
If you’re sharing this with a manager or colleague, click Full Screen to maximize the visual. Want to start over from scratch? No problem, just make sure to save if you want to reference that copy and click Clear Data. Both buttons are in the top right corner of the Fishbone Diagram sheet.
One of the best features of this template is the ability to customize it to other use cases. It can also be used for the 8 Ps, known as the marketing mix. Just change the headers to Product, Price, Place, Promotion, People, Process, Physical Evidence and Performance.
If that wasn't enough reason to get this template, did you know this template is compatible with Google Sheets? Collaborate with your co-workers in real time and enjoy the cloud auto-save feature of Sheets when you use this template!
To tailor it to the service industry, you can change the headers to the 4Ss; Surroundings, Suppliers, Systems and Skills.
More Operations Templates For You


