
Check Sheet
Excel and Google Sheet Template
🎯 Best Value: This template + 30 more
Get this template plus 30+ Supply Chain & Operations templates for just $79.
Get the Supply Chain Bundle — $79— OR continue with just this template below —
What's Inside the Check Template For Excel And Google Sheets?
Details | 2 Sheets
Supported Versions | Excel 2010, 2013, 2016, 2019, Office 365 (Mac), Google Sheets
Category | Supply Chain & Operations
Tags | Supply Chain, Six Sigma, Quality Control

Why Professionals Choose Simple Sheets
It's simple. Access to the largest library of premium Excel Templates, plus world-class training.

100+ Professional Excel Templates
Optimized for use with Excel. Solve Excel problems in minutes, not hours.

World-Class Excel University
With our university, you'll learn how we make templates & how to make your own.

How-To Videos
Each template comes with a guide to use it along with how-to videos that show how it works.
Inside Our Check Sheet Excel and Google Sheets Template

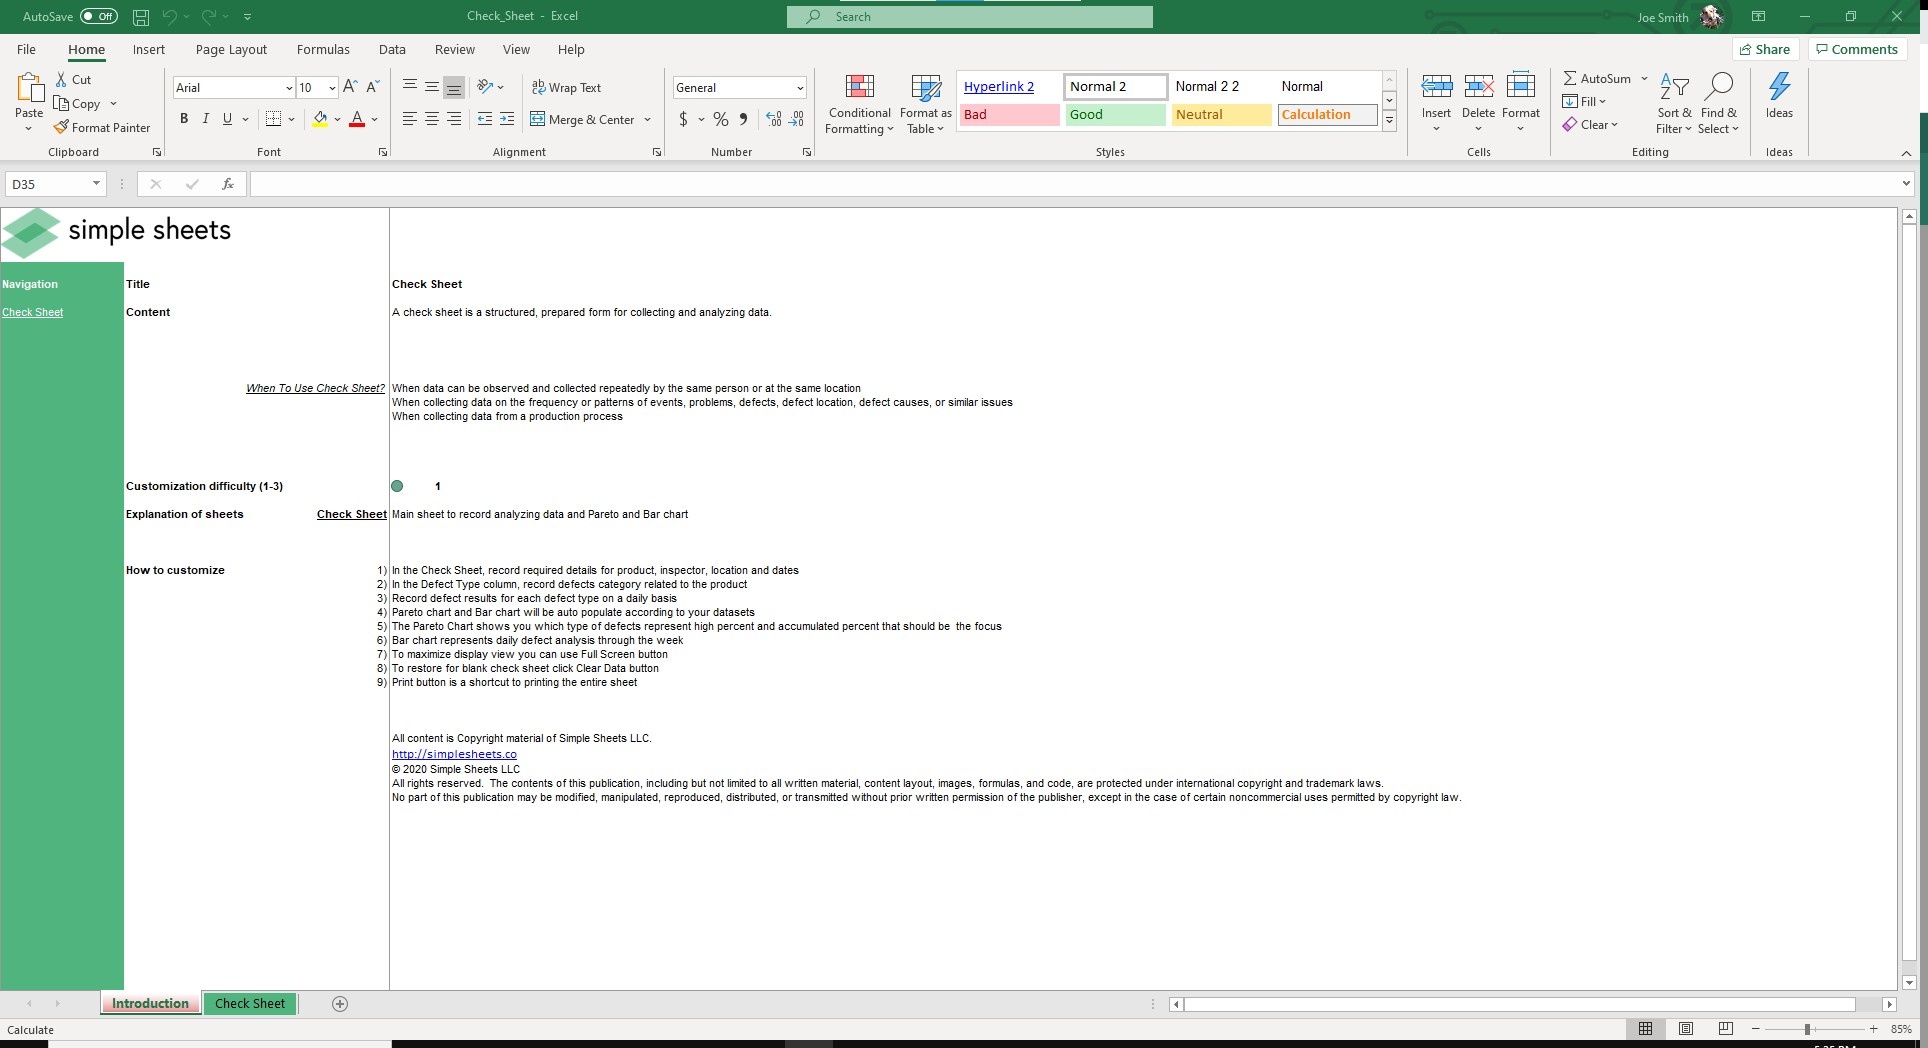
If you work in operations, you’re likely familiar with a Check Sheet. Our Check Sheet Excel Template helps you collect and analyze data in a structured way.
Often used for quality control, our template is built with a Pareto Analysis Graph and Defects Bar Chart that auto populate based on your inputs. A Check Sheet is one of the Seven Basic Tools of Quality Control, a popular tool used in Six Sigma as well.
If you find this template useful, you’ll also want to check out other statistical analysis templates like Pareto Analysis, Stratification Data Analysis, Scatter Diagram and Fishbone Diagram. Each of these templates is designed to help you analyze data faster and with more accuracy.
The formulas are baked into the template and automate the manual calculations you’d normally do to run those analyses.
Let’s dive into how to use the Check Sheet, also referred to as a Tally Sheet when using it for quantitative analysis.
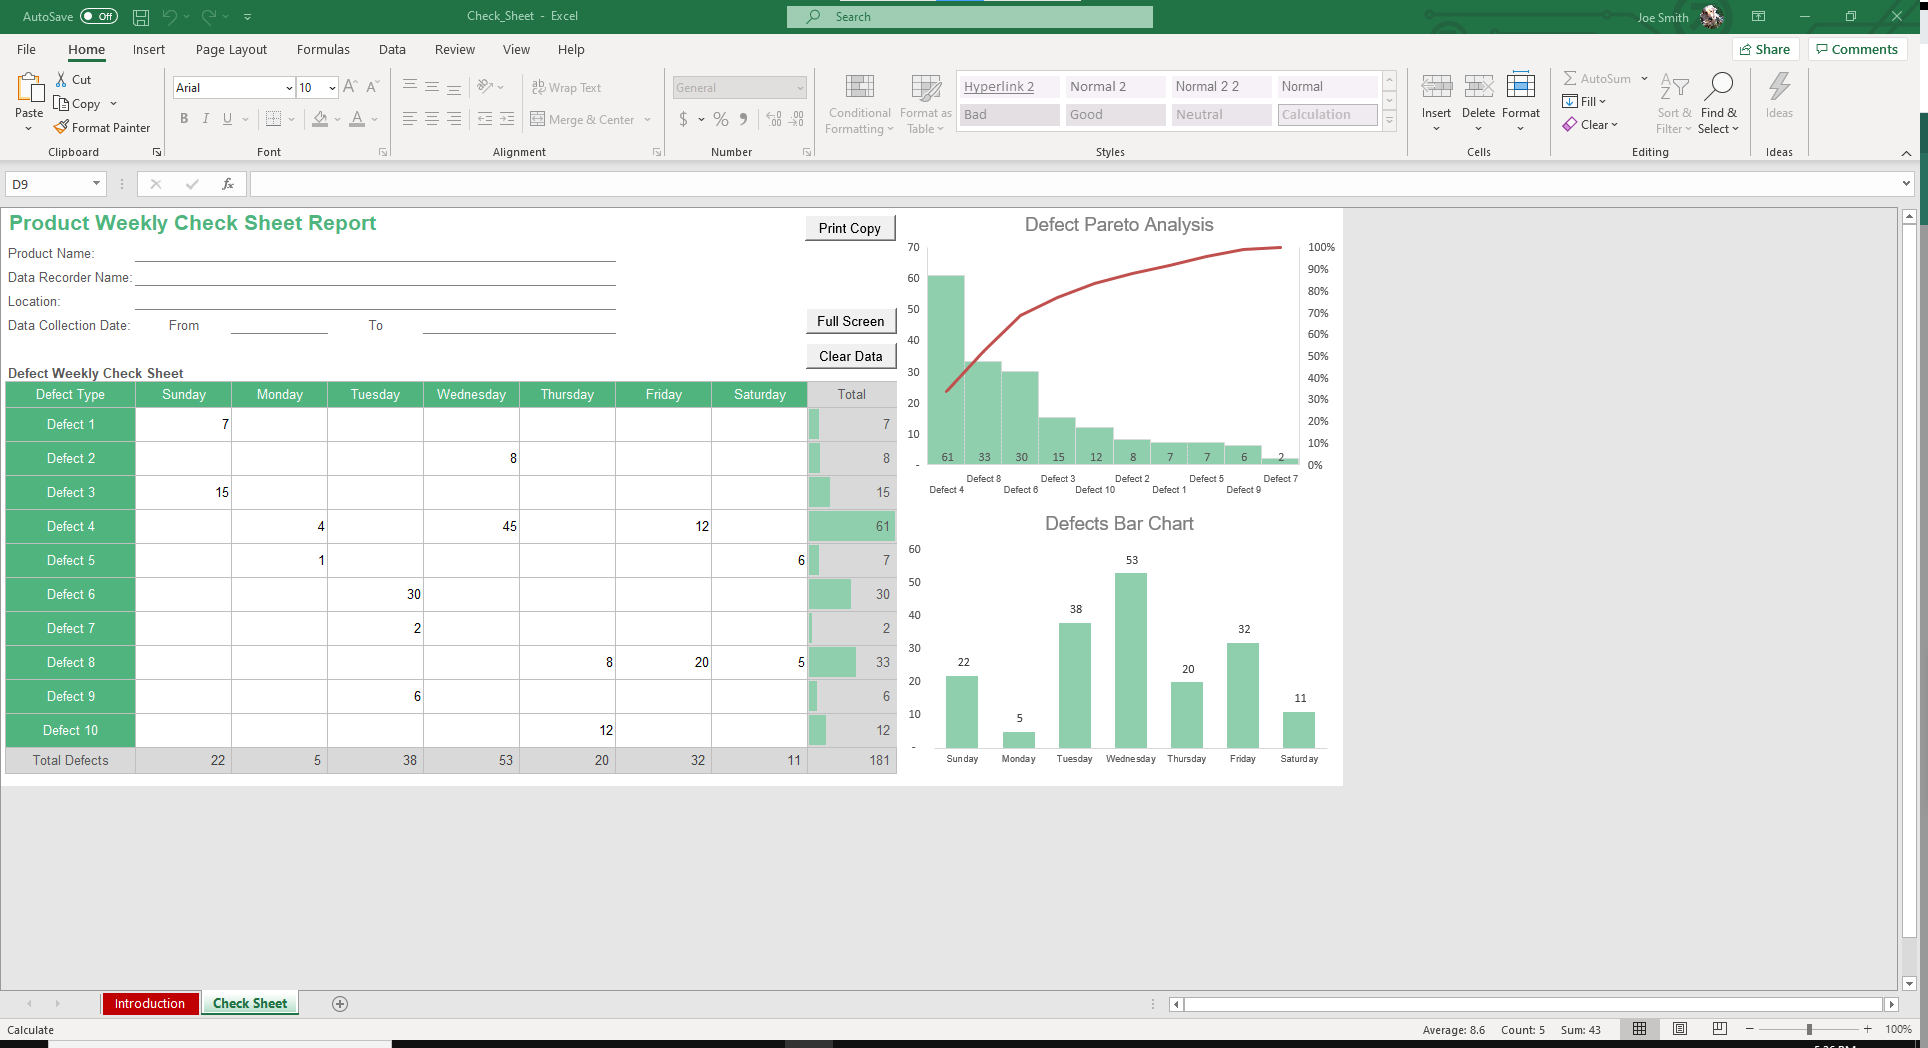
Begin by labeling the Product Weekly Check Sheet Report fields such as Product Name, Data Recorder Name, Location, and the Data Collection Date.
In the Defect Type column, record the defects category related to the product. Once that is setup, you can then record defect results for each defect type on a daily basis.
The Pareto Chart and Bar Chart will auto populate according to your data set.
These visuals make it simple to identify where the highest percentage of defects are happening.
This data can be incredibly useful because once you identify where the defects are happening, you can seek out ways to prevent them.
This is a repeatable process that has massive potential benefits for your organization, so we made it easy to be a tool you can use all the time using VBA.
Click the Clear Data button once you’ve saved it. Click the Print Copy button to have a tangible copy you can share with your boss or colleagues. Click Full Screen if you are using it during a presentation and want to maximize its visual impact.
If that wasn't enough reason to get this template, did you know this template is compatible with Google Sheets? Collaborate with your co-workers in real time and enjoy the cloud auto-save feature of Sheets when you use this template!
How to Use It
The Check Sheet template is easy to use and only takes a few minutes each week. It’s ideal for teams running inspections or tracking production issues in real time. Follow these steps to use it:
-
Enter basic details: Fill in the product name, inspector, location, and date range.
-
Add defect types: In the Defect Type column, list all the issues you want to track.
-
Log defects daily: Record the number of times each defect occurs every day.
-
Review the charts:
-
The Pareto chart shows which defects have the highest impact based on frequency.
-
The Bar chart shows when defects occur most often throughout the week.
-
-
Use macro buttons for speed:
-
Click Clear Data to reset the sheet for a new week (this can’t be undone).
-
Use Full Screen to maximize your view for presentations.
-
Hit Print to create a clean copy of your weekly report.
-
Note: Some macros may not work in Excel Online. If needed, use the “Refresh All” button instead of the macro version.
Who Is the Check Sheet Template For?
This Excel Check Sheet template is perfect for anyone who needs to track defects or monitor production quality. It’s simple enough for beginners and powerful enough for professionals.
It’s ideal for:
-
Quality control teams: Record defects and identify problem areas quickly.
-
Production managers: Monitor weekly performance and improve efficiency.
-
Lean and Six Sigma practitioners: Use it as one of the Seven Basic Quality Tools for process improvement.
-
Small businesses and manufacturers: Keep your operations organized without expensive software.
Download Now
Ready to take control of your quality tracking? Download the Check Sheet Excel and Google Sheets template today. It is easy to set up, so you can start monitoring defects in minutes.
Click this button to get your template and improve your process today.
FAQ
Can I use this template in Google Sheets?
The Check Sheet template works in both Excel and Google Sheets.
Does it work in older versions of Excel?
We recommend Excel 2016 or later for the best experience, especially for charts and macros.
Can I customize defect types?
You can add or edit defect types to match your production process.
What if macros don’t work in Excel Online?
You can still use the sheet. Instead of macros, use the “Refresh All” button in the Excel Online ribbon.
What is a Pareto chart?
It’s a chart that shows which defects happen most often so you can focus on the biggest problems first.
About Simple Sheets
At Simple Sheets, we create easy-to-use Excel and Google Sheets templates that save time and simplify work. Our tools are built for professionals who want smart, automated solutions without needing complicated software.
If you liked the Check Sheet template, you may also check out our templates for production scanning system, Cost of Quality analysis, and inventory management.
More Operations Templates For You


