
Burndown Chart
Excel Template
What's Inside the Burndown Chart Template?
Details | 2 Sheets
Supported Versions (All Features) | Excel 2016, 2019, Office 365 (Mac)
Supported Versions (Significant Features) | Excel 2010, 2013, 2016, 2019, Office 365 (Mac)
Category | Project Management
Tags | Agile, Scrum, Tasks

Why Professionals Choose Simple Sheets
It's simple. Access to the largest library of premium Excel Templates, plus world-class training.

100+ Professional Excel Templates
Optimized for use with Excel. Solve Excel problems in minutes, not hours.

World-Class Excel University
With our university, you'll learn how we make templates & how to make your own.

How-To Videos
Each template comes with a guide to use it along with how-to videos that show how it works.
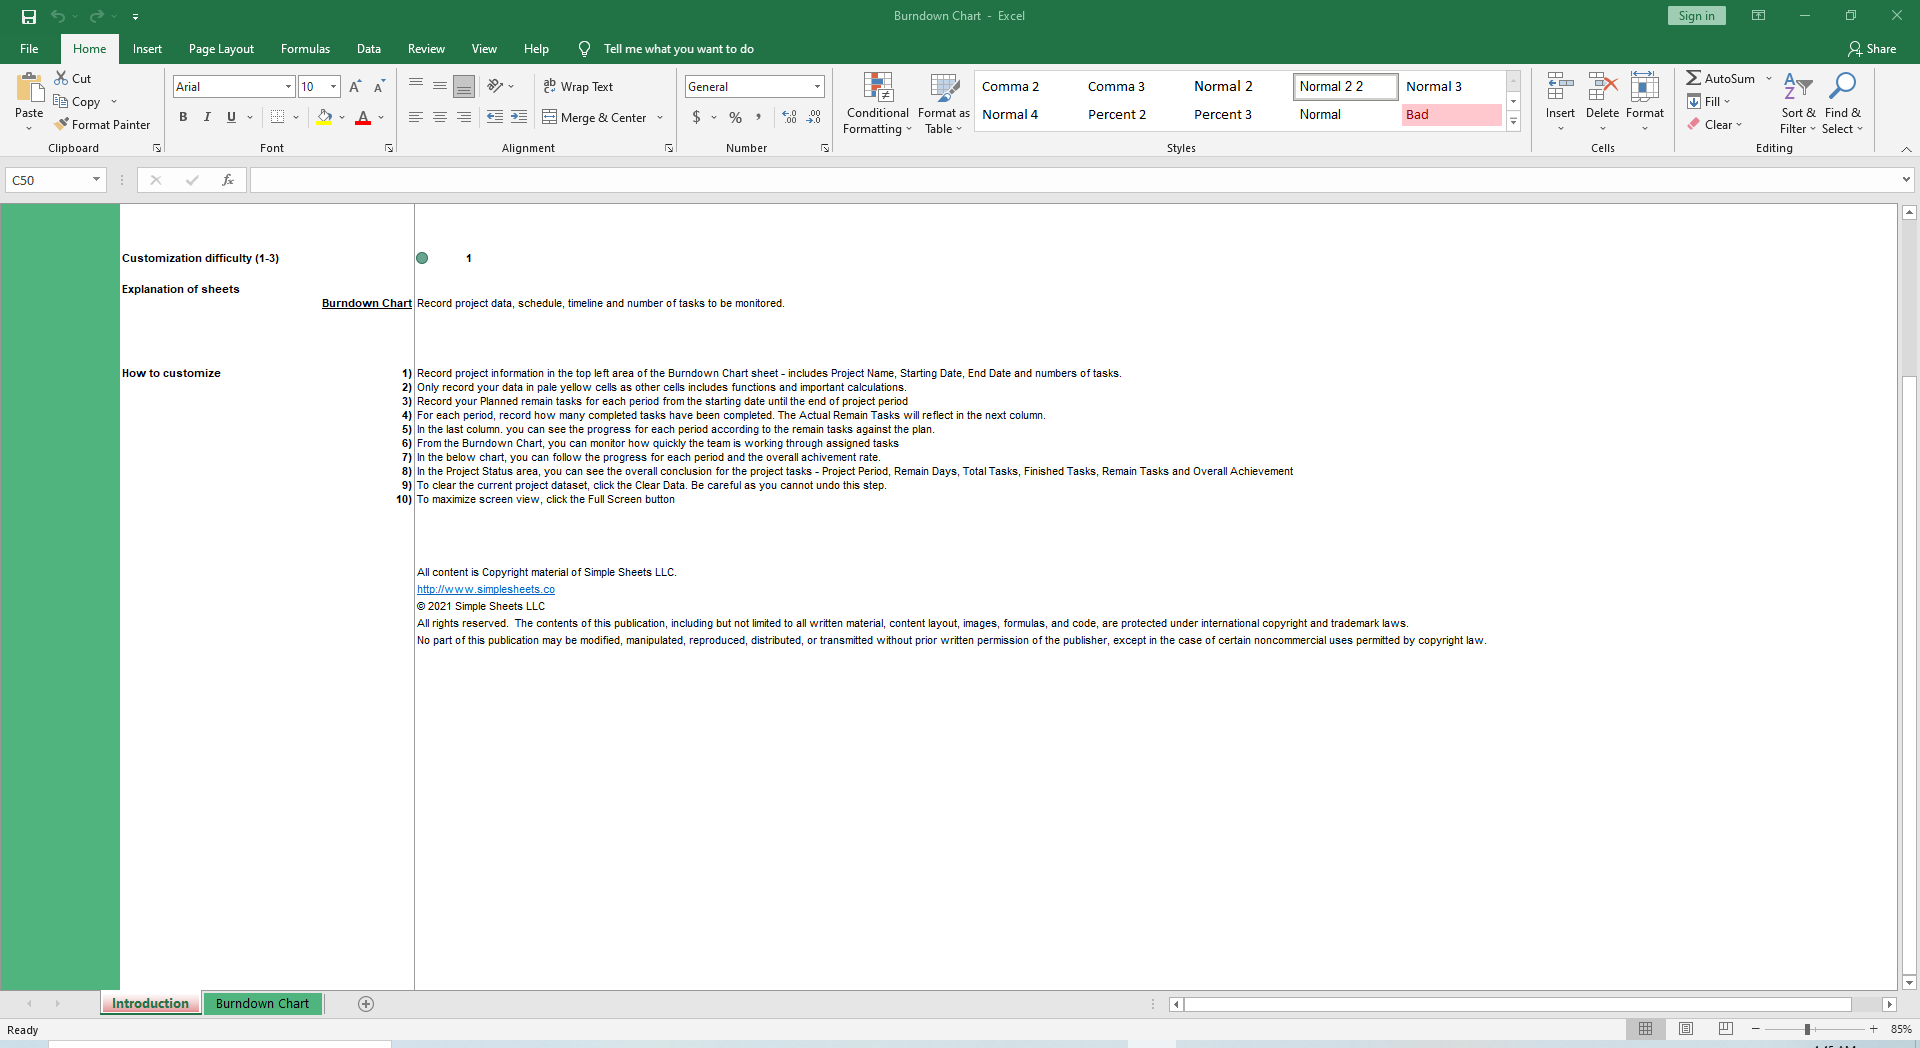
Inside Our Burndown Chart Excel Template
Tracking your team’s progress is essential to making strides and setting realistic deadlines. Our Burndown Chart Excel Template makes understanding the progress of your project clear.
A Burndown Chart is used for calculating how much work in a task is left and how much time there is to do it. It also shows a graphic representation of how quickly the team is working through assigned tasks.
This is one of many awesome (we’re not humble) Project Management templates we offer. If you find this useful, you’ll also want to check out our Gantt, Kanban, PDCA or Earned Value Analysis templates.
Let’s dive into a step-by-step tutorial of how to use this template.
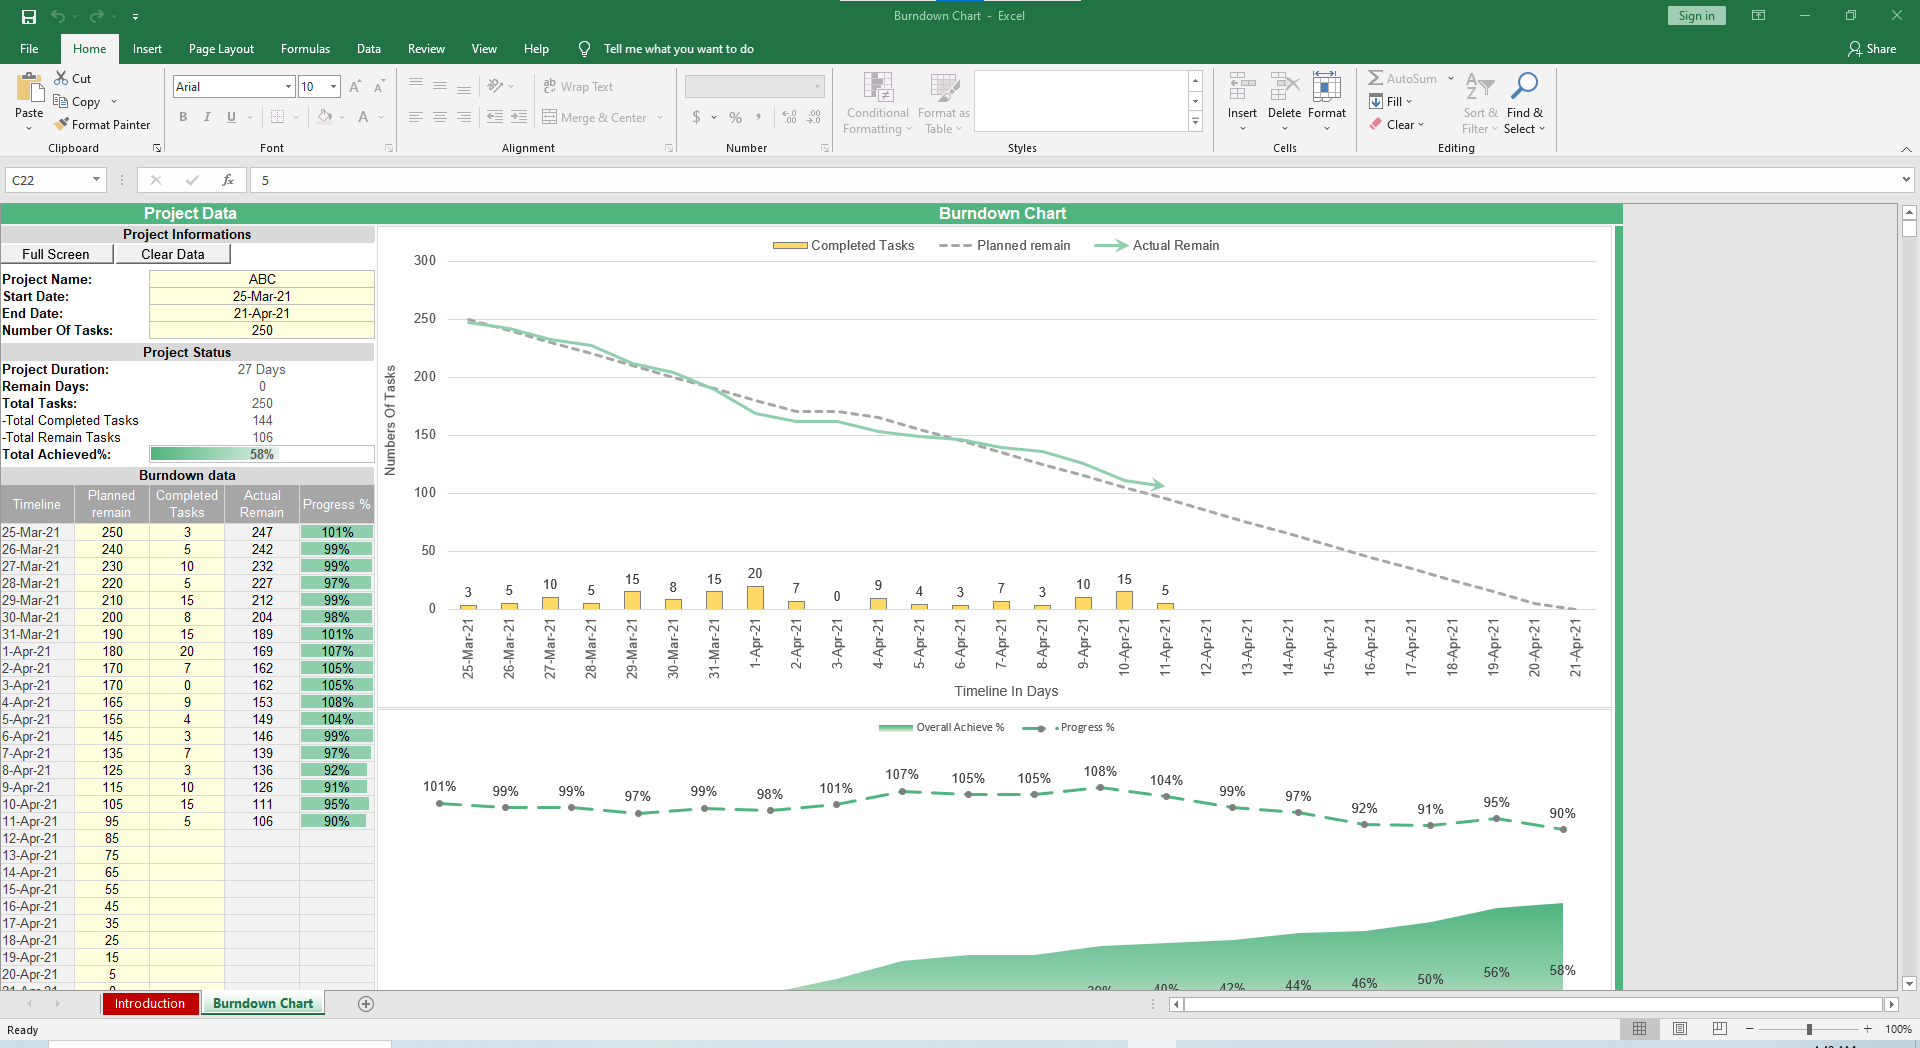
Start off by recording your Project Name, Start Date, End Date and Number of Tasks in the top left hand corner of your screen.
Move to the table titled Burndown Data. There are only two other columns you will need to edit, Planned Remain and Completed Tasks. The Timeline, Actual Remain and Progress Percentage visual will calculate automatically.
Above the Burndown Data table, is the Project Status section. Your Project Duration, Remain Days, Total Tasks, Total Completed Tasks, Total Remain Tasks and Total Achieved % will automatically calculate.

To the right of our tables is a visual of our burndown data, charting Number of Tasks on the Y-Axis and Timeline (in Days) on the X-Axis. There are three different data points charted; Completed Tasks in yellow, Planned Remain in grey and Actual Remain in green.
Right below that is a line graph that features Overall Achievement % and Progress %.
As with most of our templates, we provide shortcuts to make the template more accessible and easy to use. In the top left corner is a Clear Data button for you to reset your data or start a new project. If you are presenting in an all-hands or sharing with your team, click Full Screen to make it more digestible to your audience.
More Project Management Templates For You


