
Cost Benefit Analysis
Excel Template
What's Inside the Cost Benefit Analysis Template?
Details | 3 Sheets
Supported Versions | Excel 2010, 2013, 2016, 2019, Office 365 (Mac)
Category | Management, Finance, Operations
Tags | ROI, NPV, Payback Period

Why Professionals Choose Simple Sheets
It's simple. Access to the largest library of premium Excel Templates, plus world-class training.

100+ Professional Excel Templates
Optimized for use with Excel. Solve Excel problems in minutes, not hours.

World-Class Excel University
With our university, you'll learn how we make templates & how to make your own.

How-To Videos
Each template comes with a guide to use it along with how-to videos that show how it works.
Inside Our Cost Benefit Analysis
Excel Template
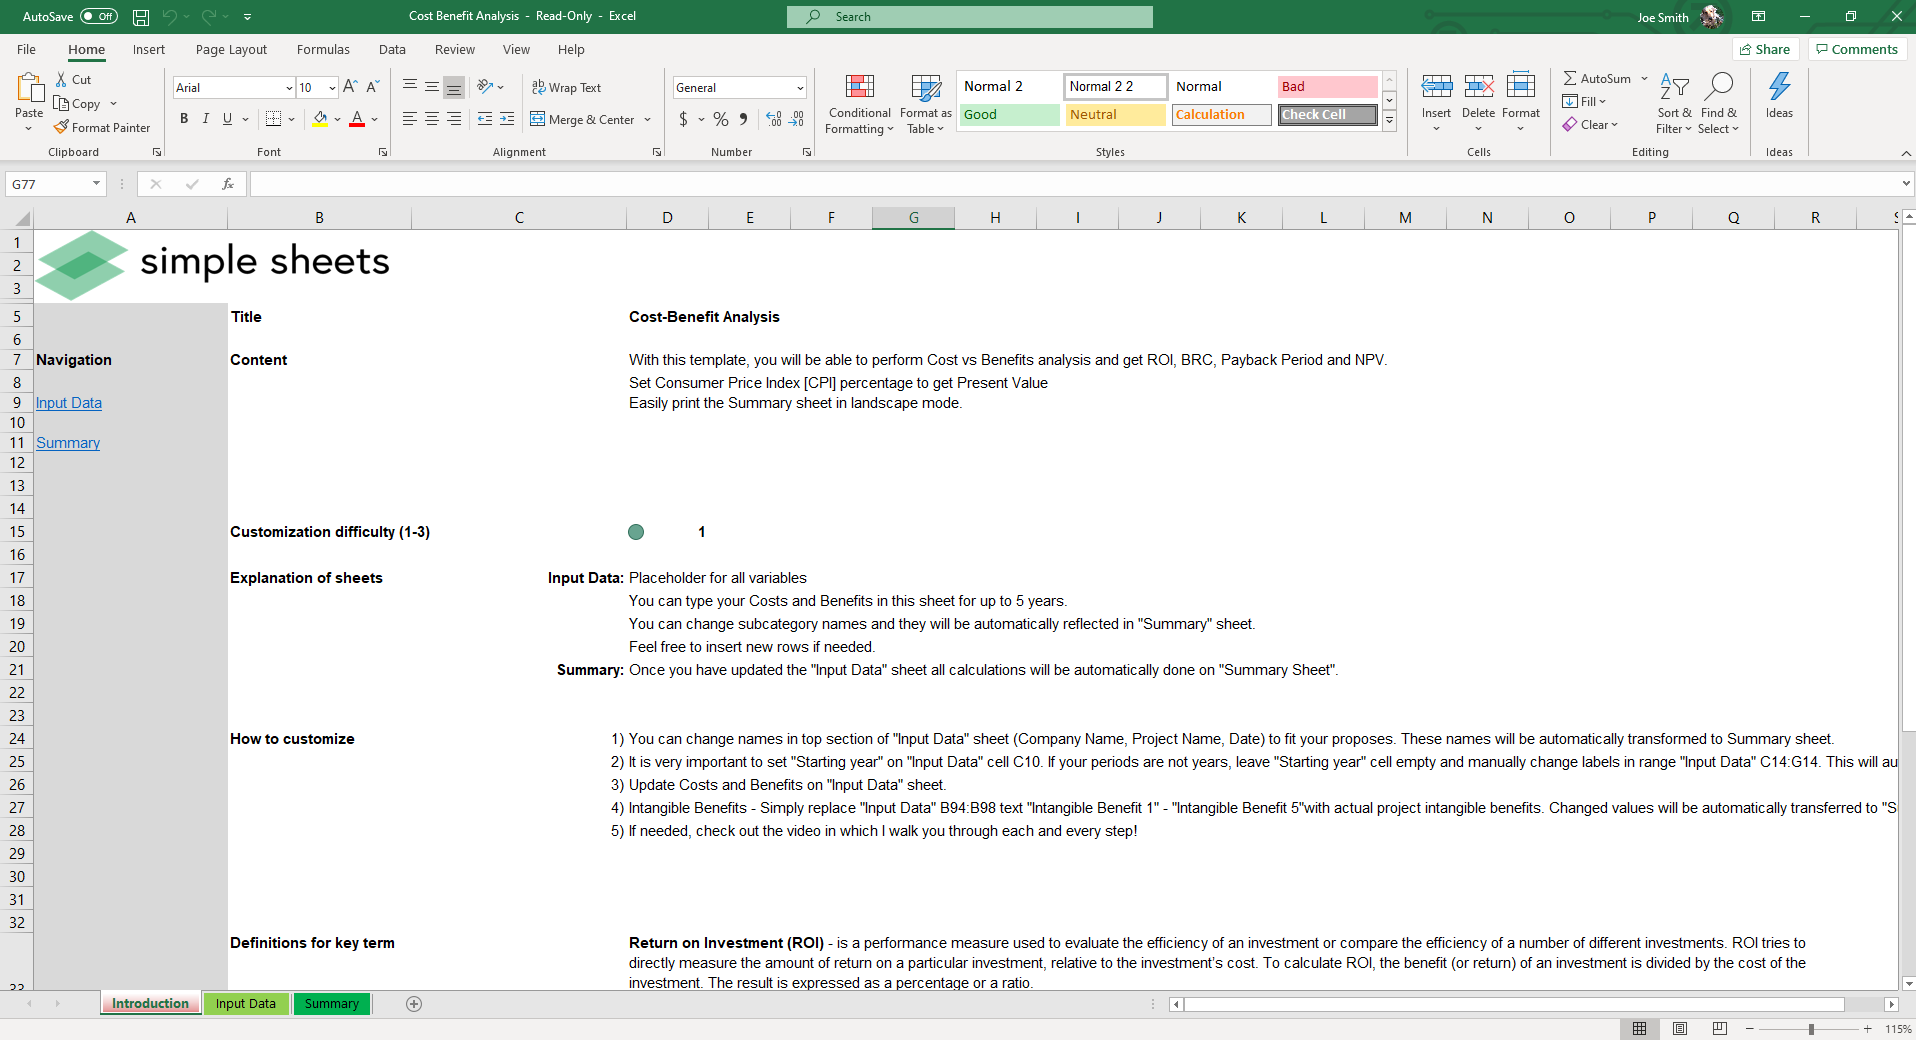
Everyday we make hundreds of cost-benefit analyses in our head. Most of them are small things, like whether to pack a lunch or not. While most people unconsciously process certain choices through a cost-benefit analysis, more analytical people understand there is a system for making these decisions.
That’s where our Cost-Benefit Analysis Excel Template comes in handy. With this template you can perform a costs vs. benefits analysis to measure Return on Investment (ROI), Benefit Cost Ratio (BCR), Payback Period and Net Present Value (NPV). By setting the Consumer Price Index (CPI) percentage, you can also calculate the Present Value.
For a fast return-and-payback read, use the free ROI calculator.
If you love this template, you’re also going to find our Profitability Analysis, Cash Flow Planning, Make or Buy and Cost of Quality Excel Templates very useful. Rather than build these tools from scratch, our library of spreadsheets empowers you to make better decisions with the proven financial methodologies and models.
Let’s dive into how to use this template.
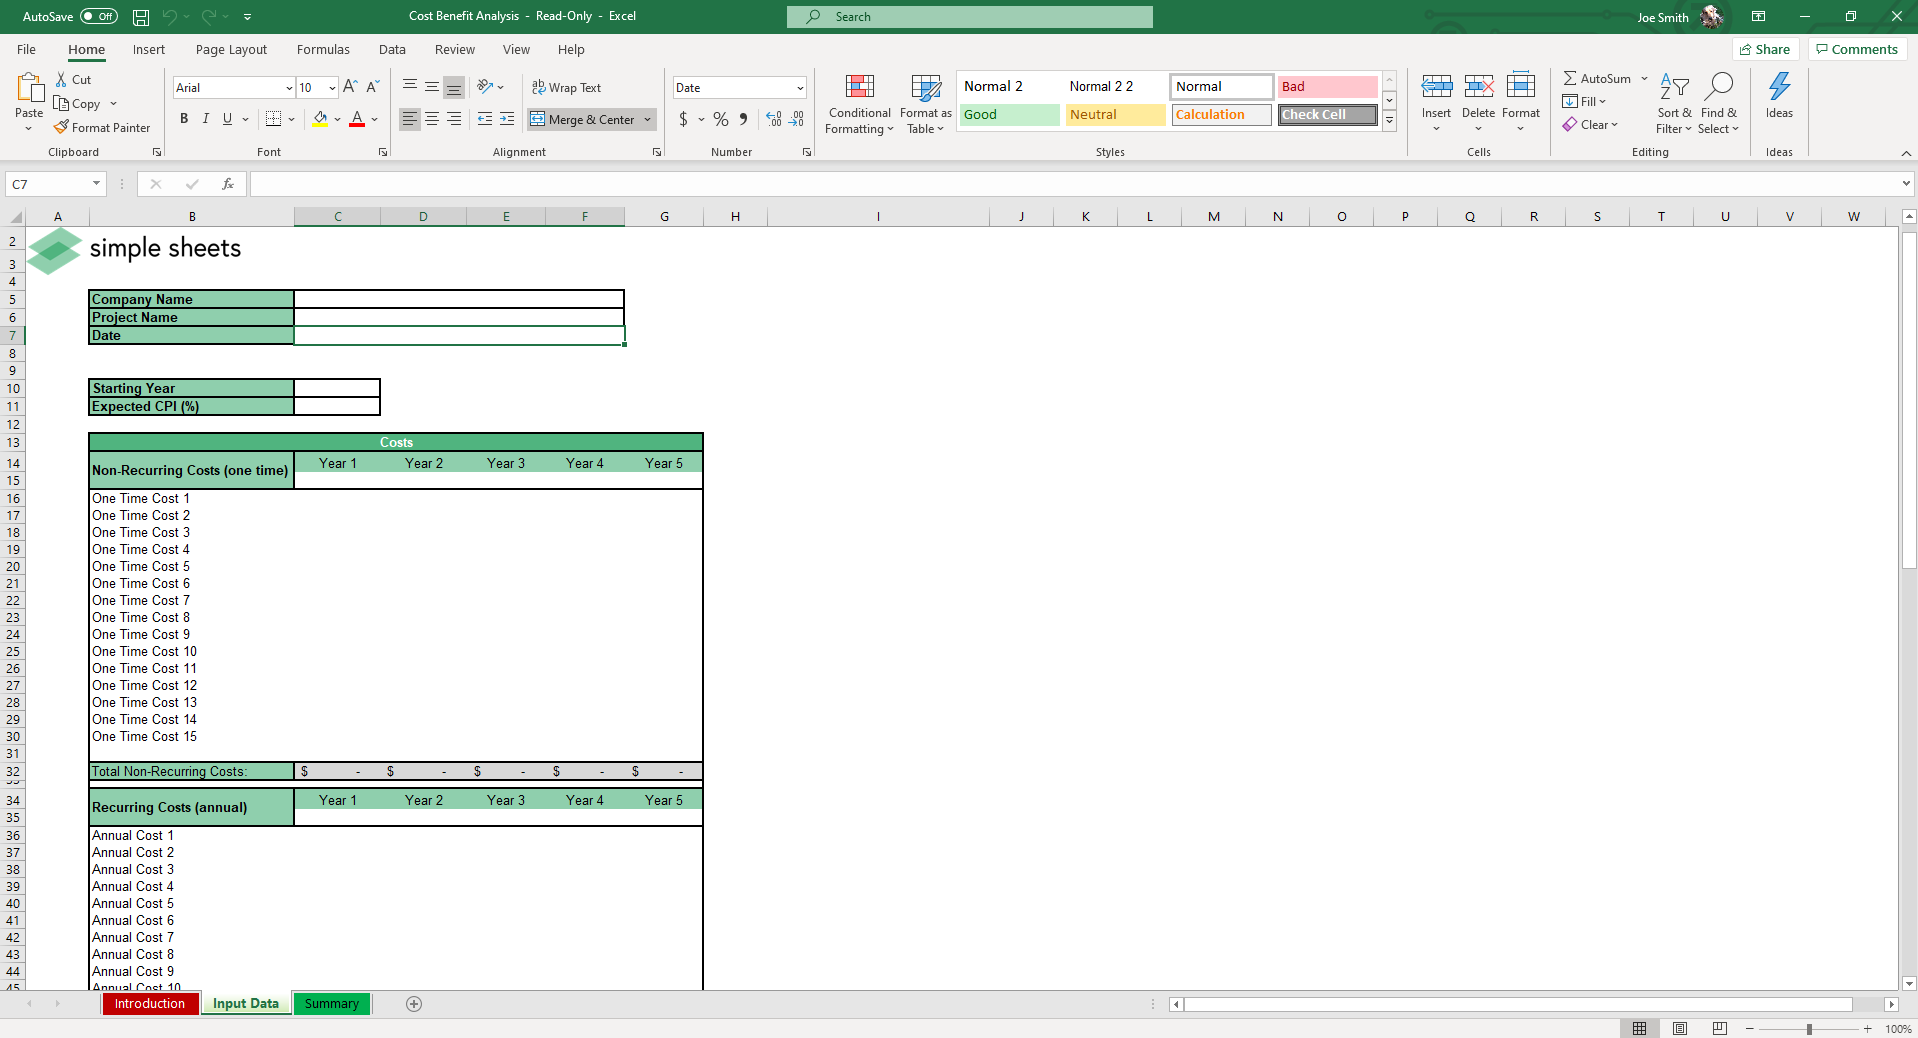
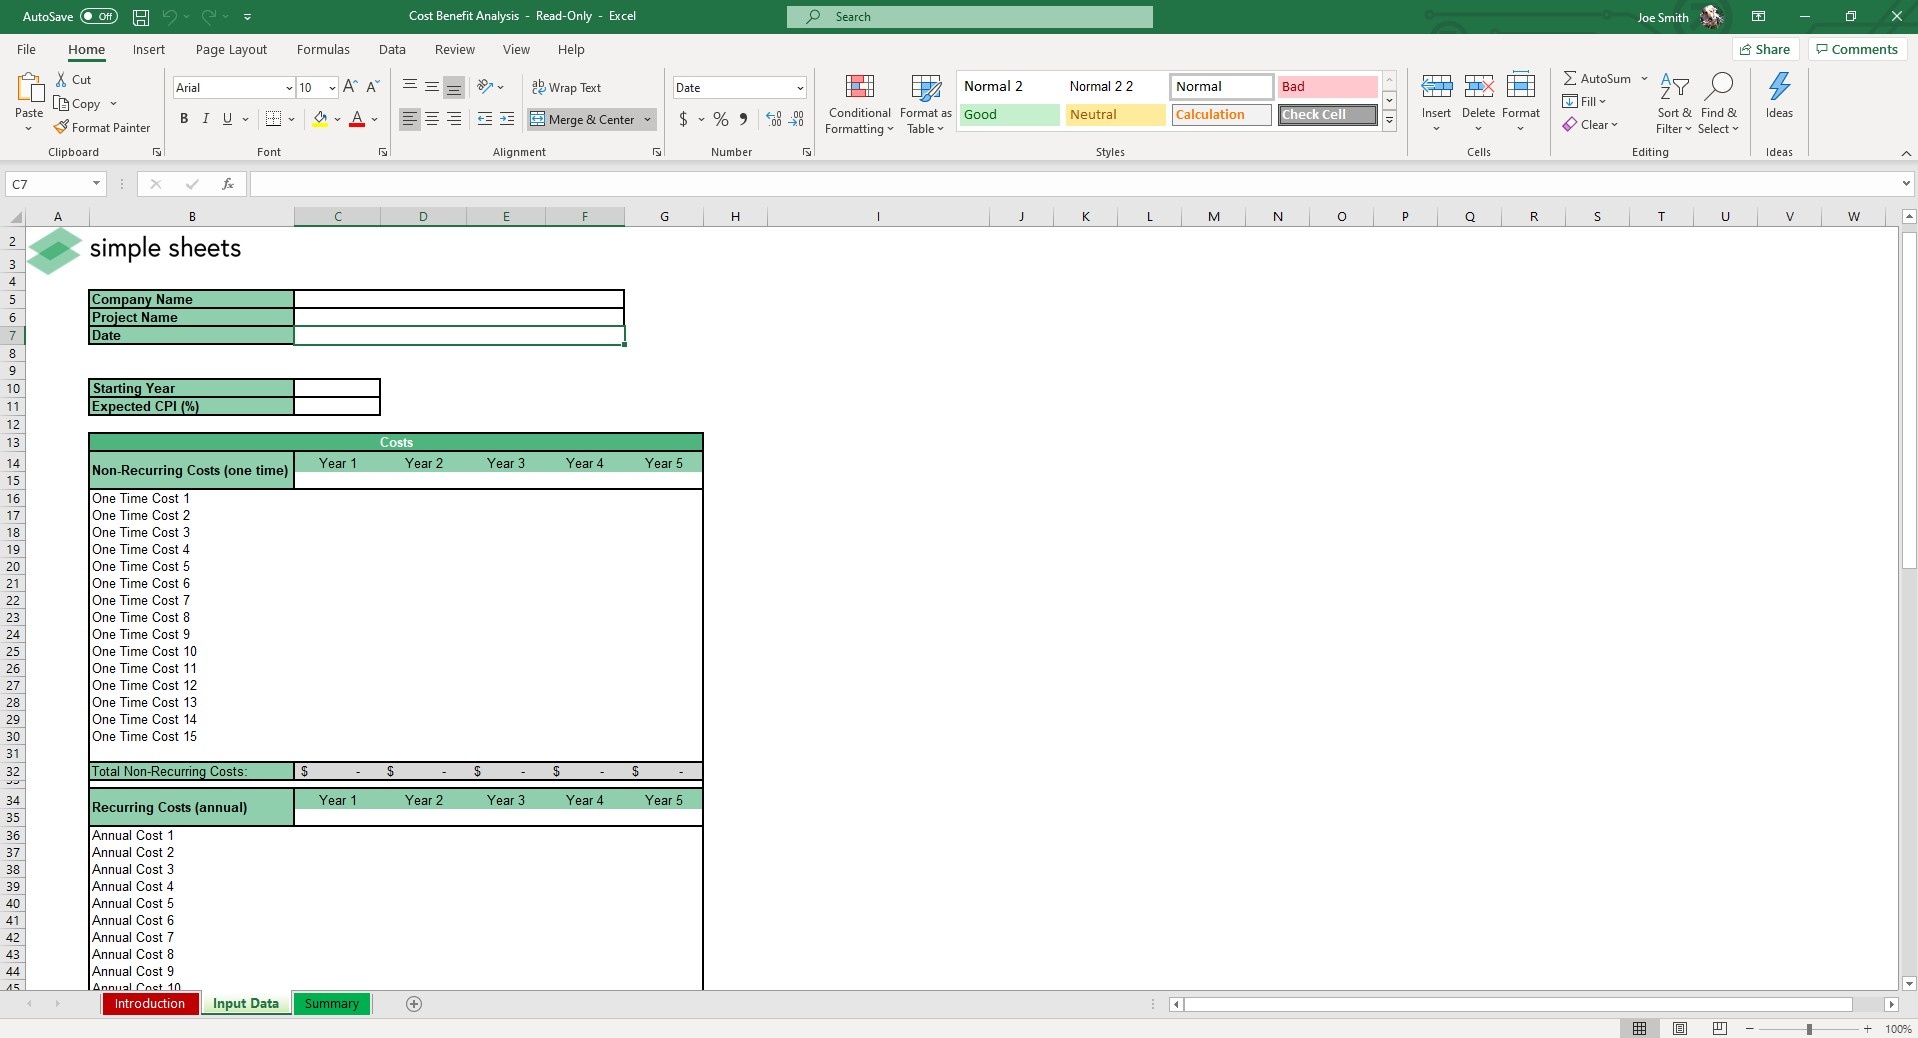
In the header of the Input Data sheet, enter the Company Name, Project Name and Date to fit your purposes. Mark your starting year in cell C10.
Enter your Costs and Benefits.
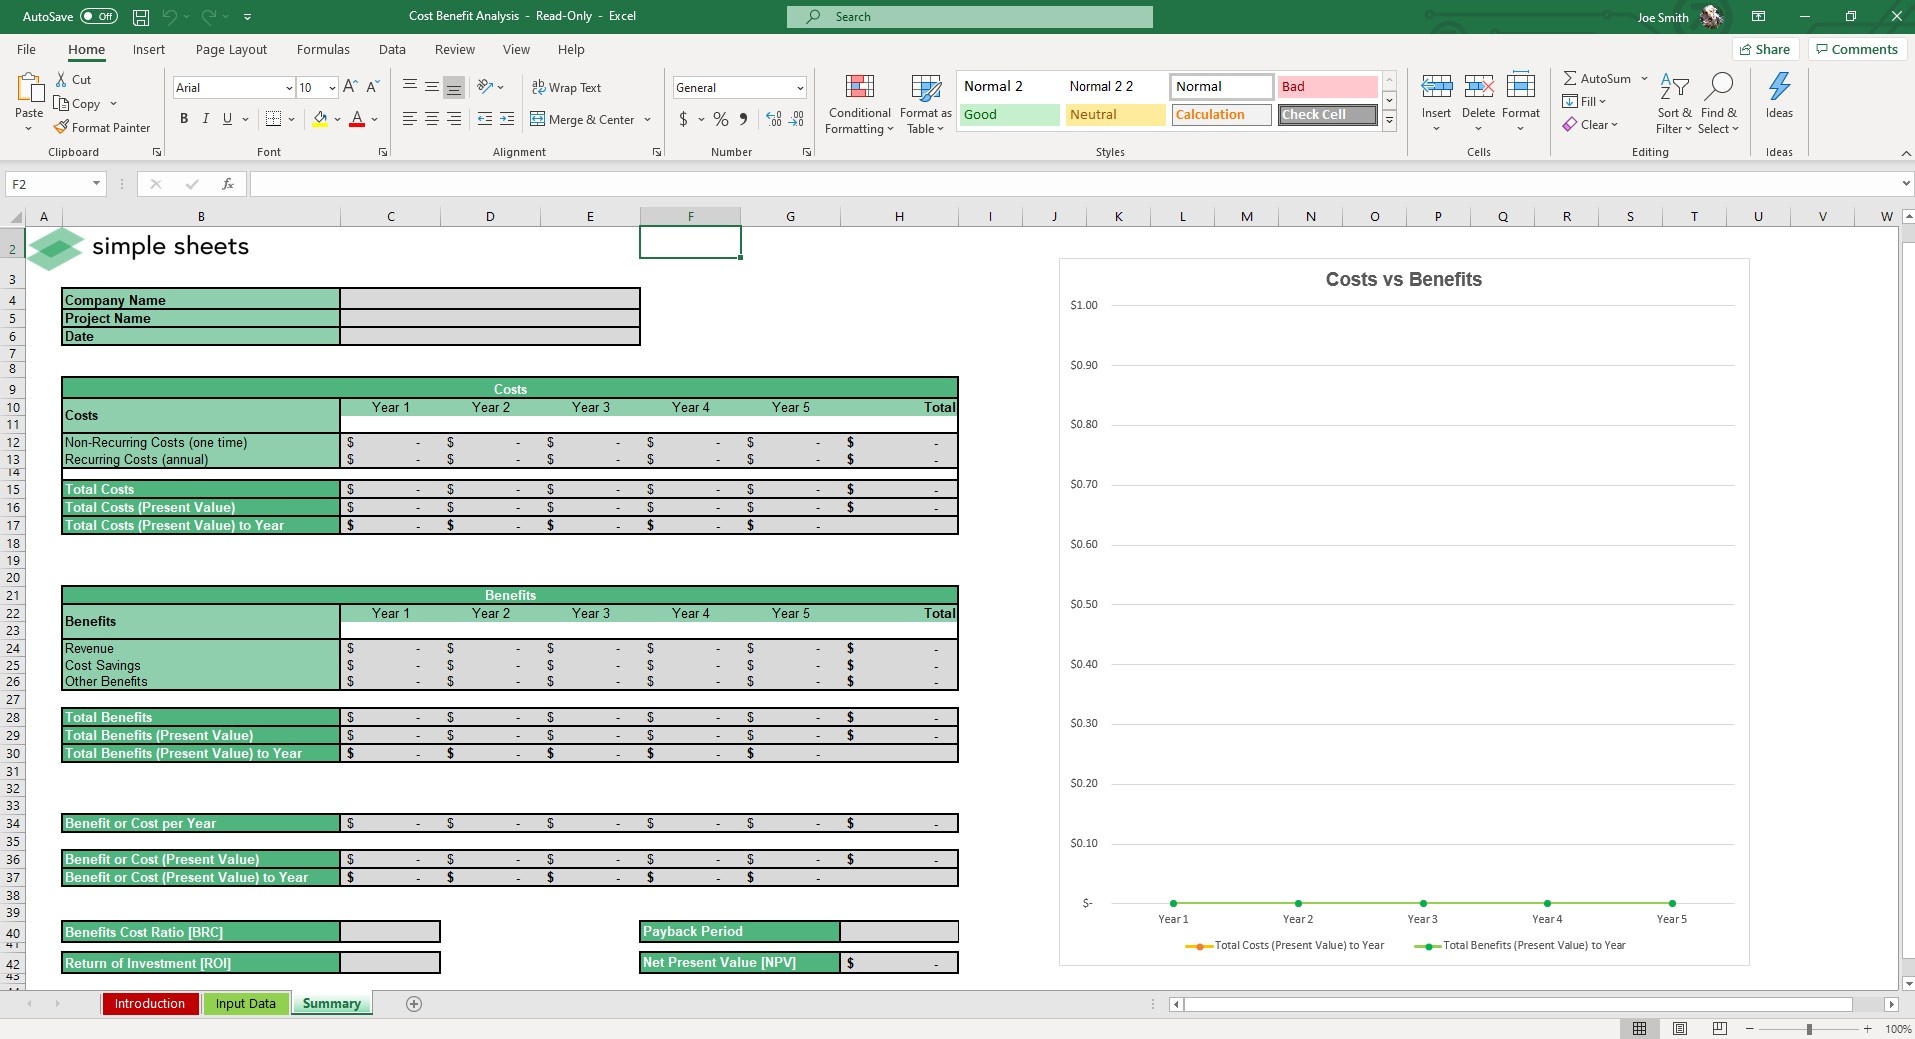
As long as you have that data, the template will do the rest of the work in calculating all your key metrics as it relates to a Cost Benefits Analysis. You’ll notice that the cells in the Summary sheet have a grey shadow, meaning you don’t need to touch them. They will auto populate from your data in the Input Data sheet.
Right of the table is a scatter-plot chart that makes it easy to visualize the Total Costs vs. the Total Benefits.
As with all of our templates, it’s not enough to provide the right framework and formulas for achieving business processes. Our goal is to make data actionable. Visuals help communicate that to people who are less numbers oriented and more visual oriented.
We know this template will help you better understand the weight of making decisions bigger than whether to pack lunch or not.
More Management Templates For You


