
Master Production Schedule (MPS) Template for Excel & Google Sheets
🎯 Best Value: This template + 30 more
Get this plus 30+ Supply Chain & Operations templates for just $79.
Get the Supply Chain & Operations Bundle — $79— OR continue with just this template below —
What's Inside the Master Production Schedule Template?
Details | 5 Sheets
Supported Versions | Excel 2010, 2013, 2016, 2019, Office 365 (Mac), Google Sheets
Category | Supply Chain & Operations
Tags | Planning, Aggregate, Customer Orders, Operation Rate
Why Professionals Choose Simple Sheets
It's simple. Access to the largest library of premium Excel Templates, plus world-class training.

100+ Professional Excel Templates
Optimized for use with Excel. Solve Excel problems in minutes, not hours.

World-Class Excel University
With our university, you'll learn how we make templates & how to make your own.

How-To Videos
Each template comes with a guide to use it along with how-to videos that show how it works.
Inside Our Master Production Schedule
Excel and Google Sheets Template

Successfully managing a production line is a bit like being a composer. Without every instrument working in unison and on time, it can mess up the entire flow of the orchestra. The same goes for manufacturing: a single error can set back scheduling, cause costly stockouts, and reduce your operating rate below satisfactory levels.
That’s where our premium master production schedule template comes in handy. This production schedule excel template is used to assess, display, and schedule the production of items for each business period, ensuring your supply consistently meets customer demand.
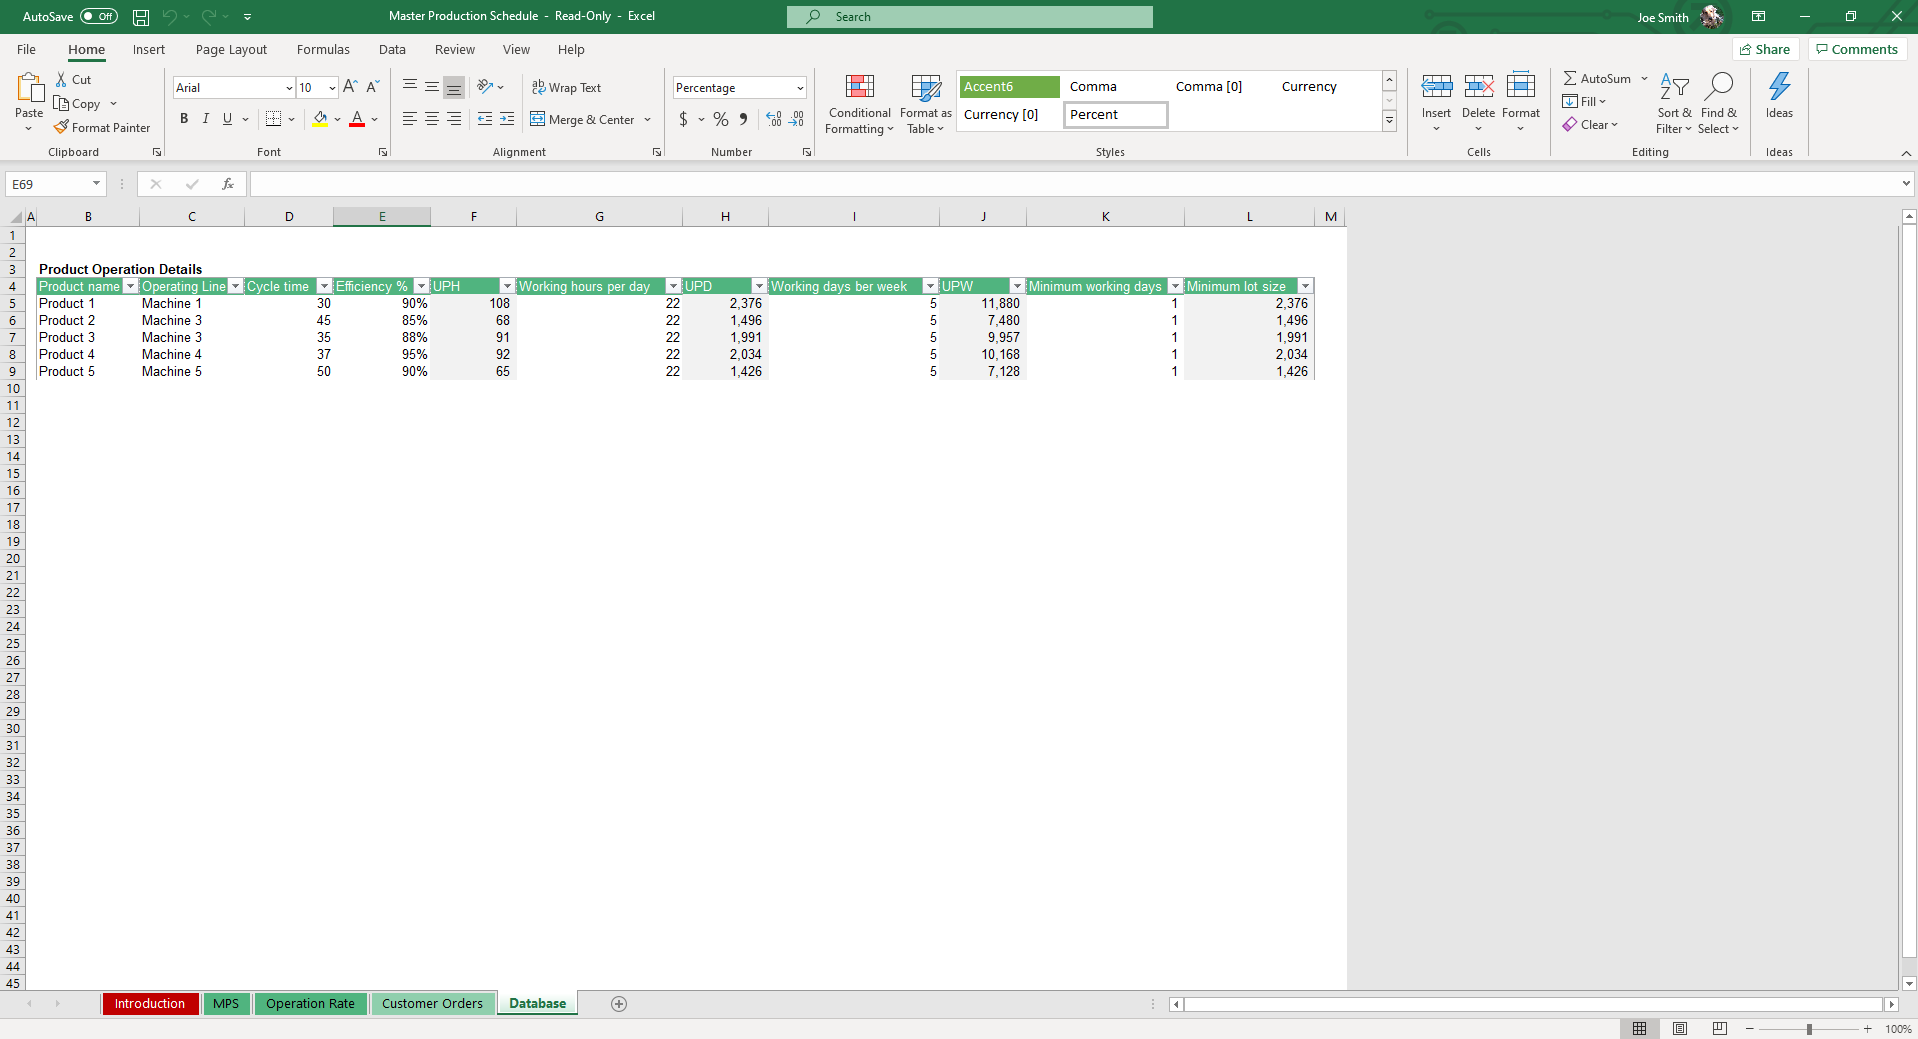
Start by recording organizational standards in the Database sheet. Fields include Product Name, Operating Line, Cycle Time, Efficiency %, Units Per Hour, Working Hours Per Day, Units Per Day, Working Days Per Week, Units Per Week, Minimum Working Days and Minimum Lot Size.
Move to the Operation Rate sheet and enter record available lines used in production.
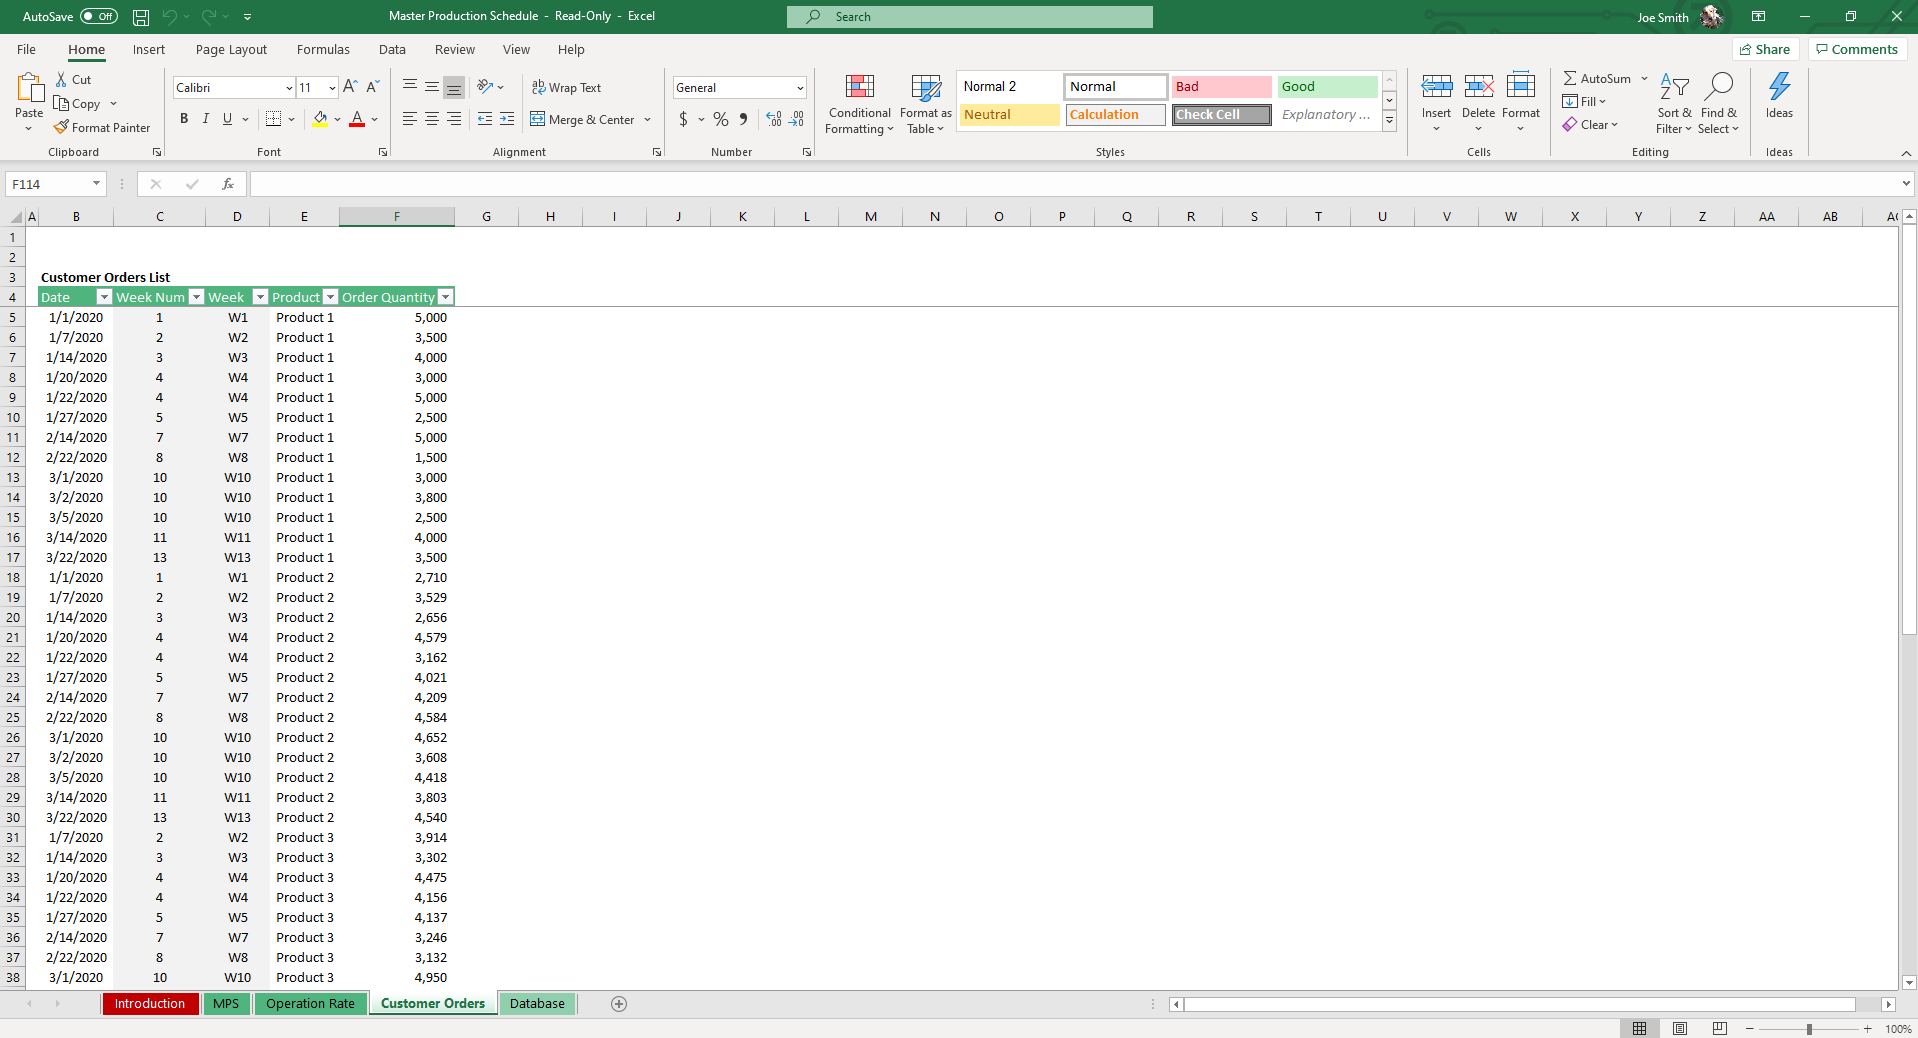
Hop over to the Custom Orders sheet and record all confirmed orders and the corresponding Date and Order Quantity. To record a new entry, register your order in the last row.
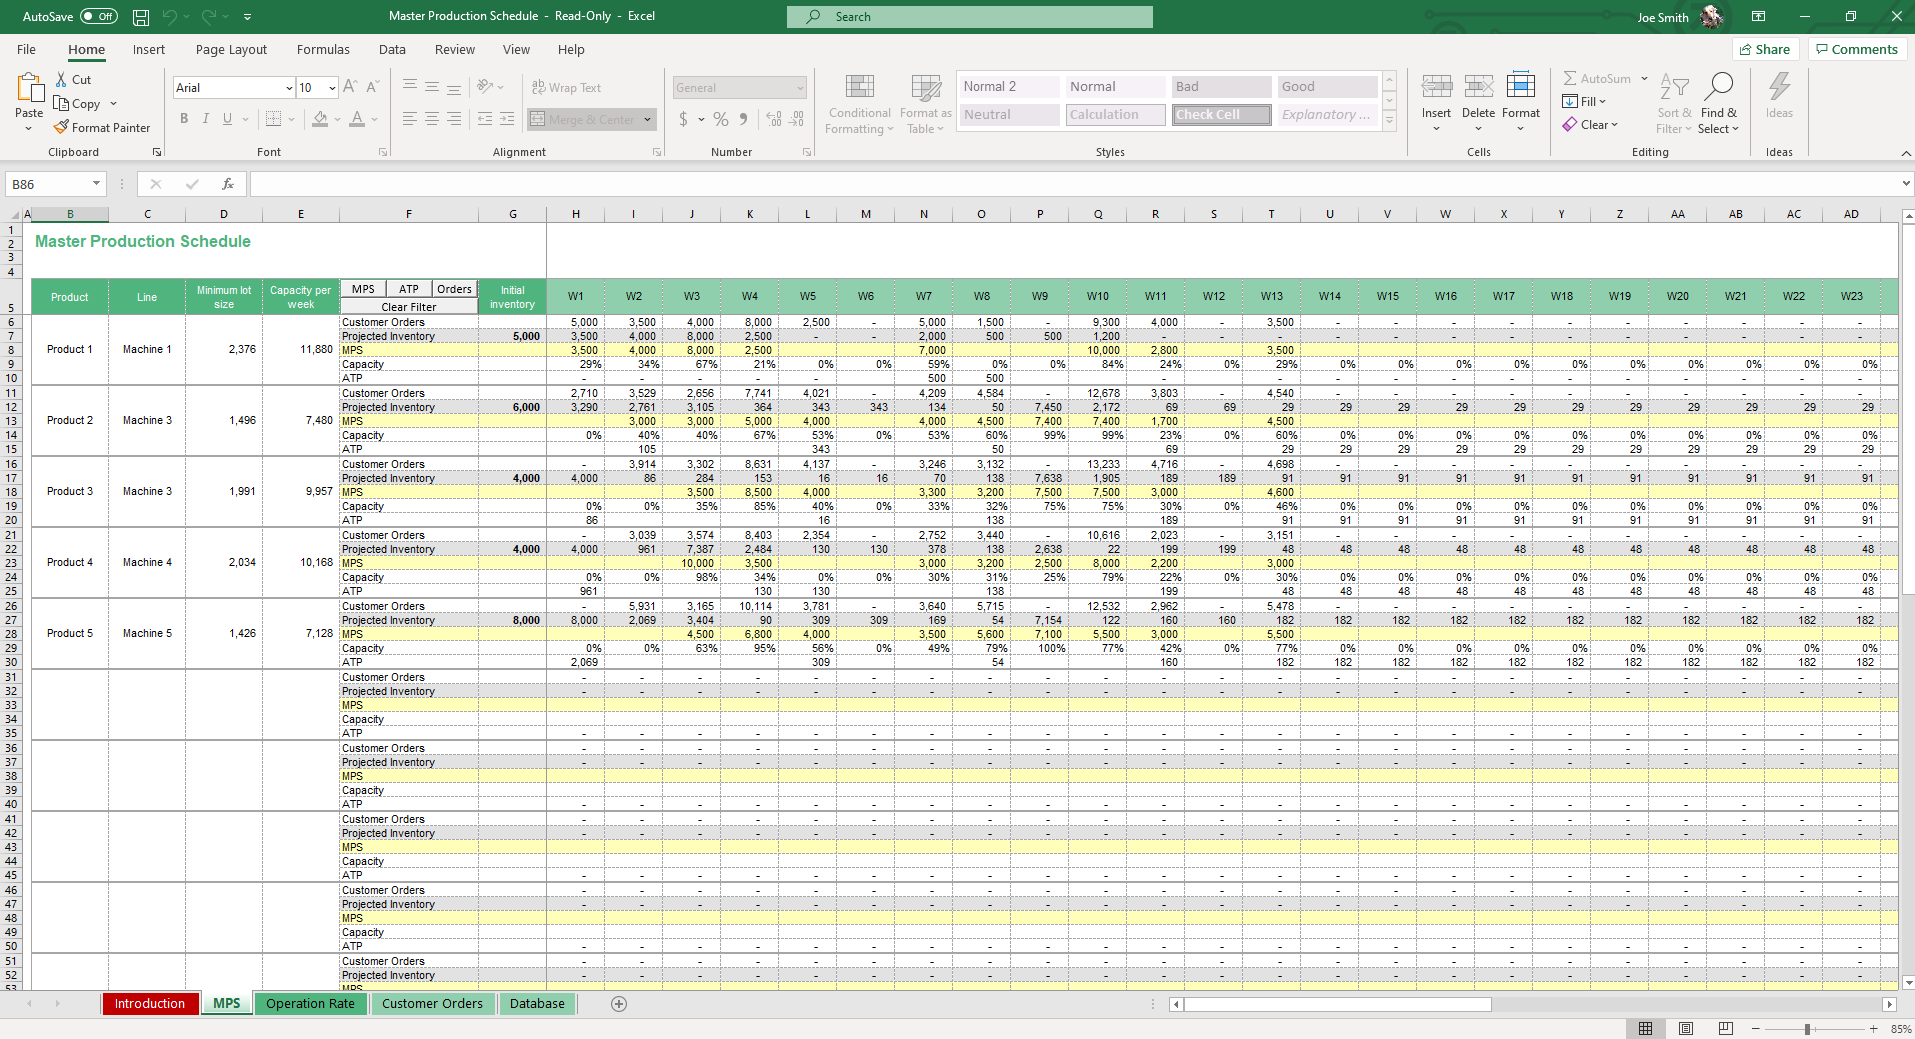
We’re ready to move to the big enchilada of this template, the MPS sheet. Select each of your products to be added to the Master Production Schedule. Certain fields will update automatically based on your prior inputs, fields such as Operating Line, Lot Size and Capacity. Add Projected Stock for each product.
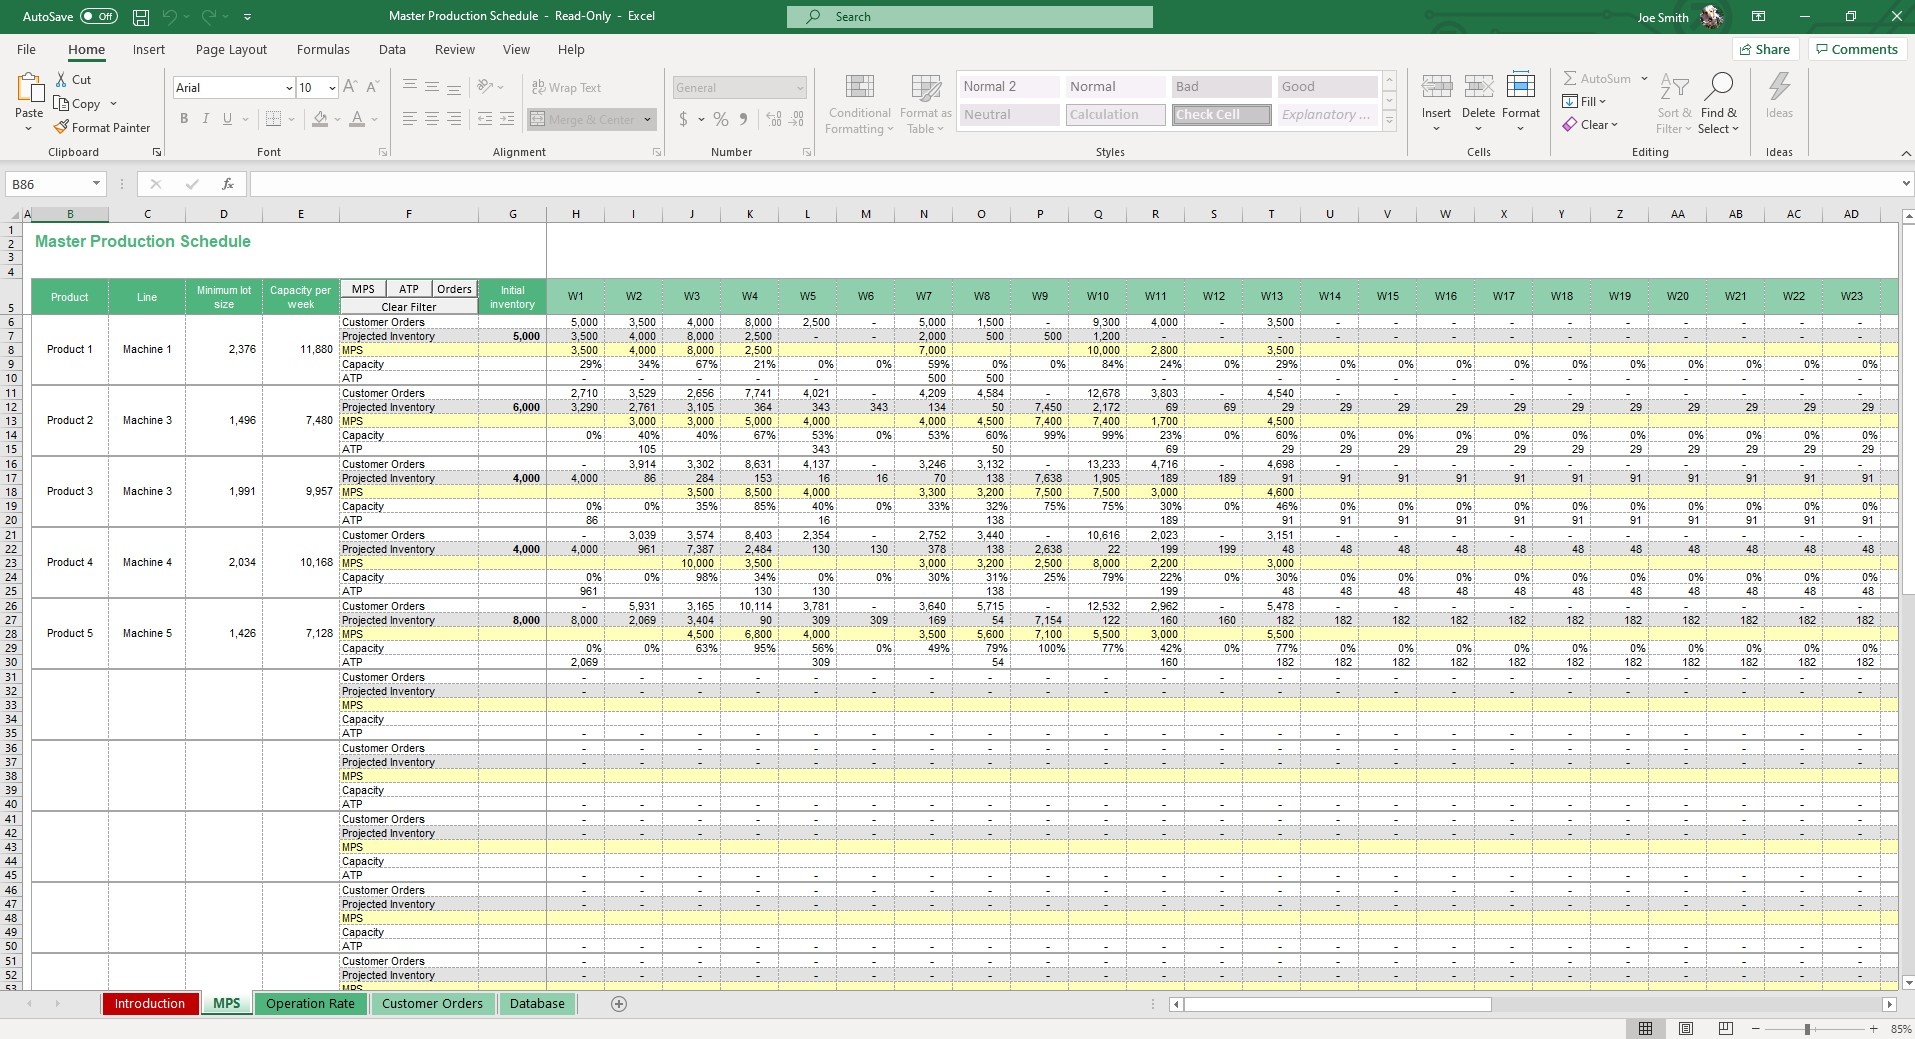
Add your production quantity according to the schedule to cover customer orders.
Dynamic filters allow you to preview MPS, ATP (Availability to Promise, essentially the projected inventory available to sell) and custom orders.
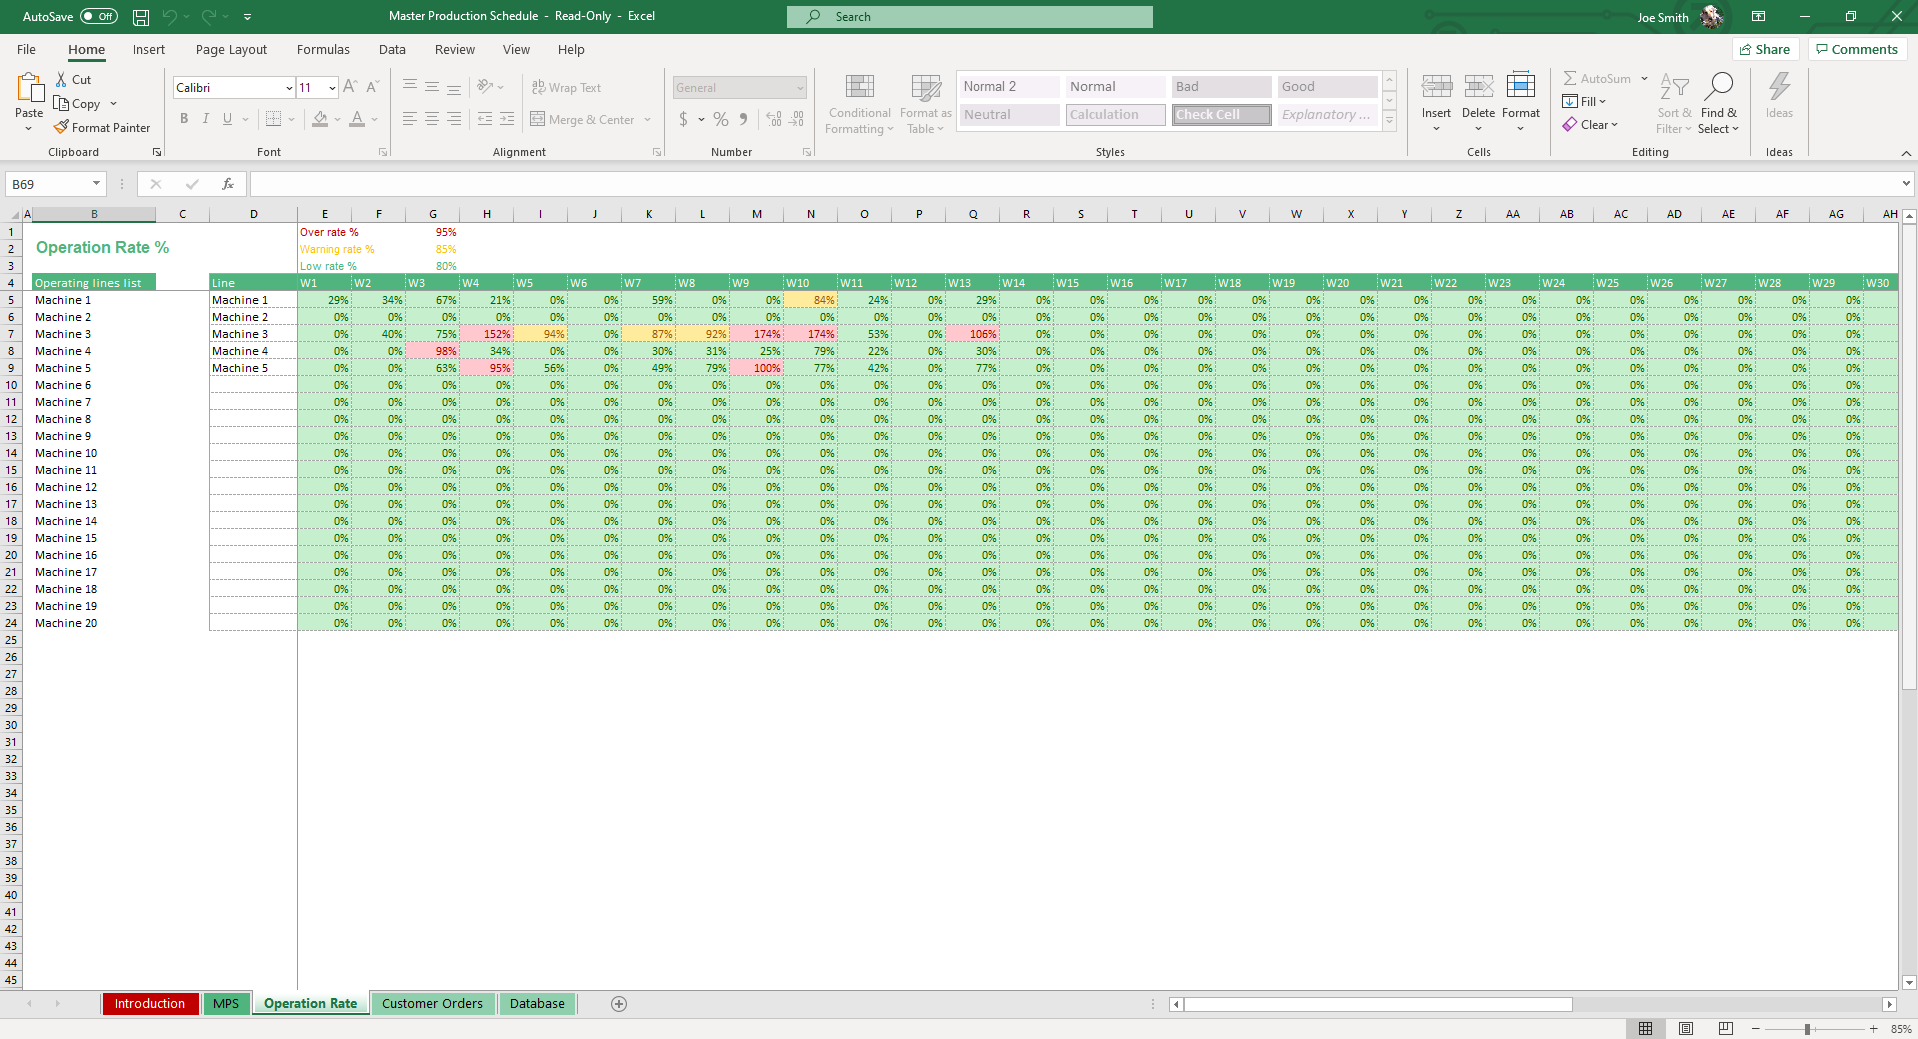
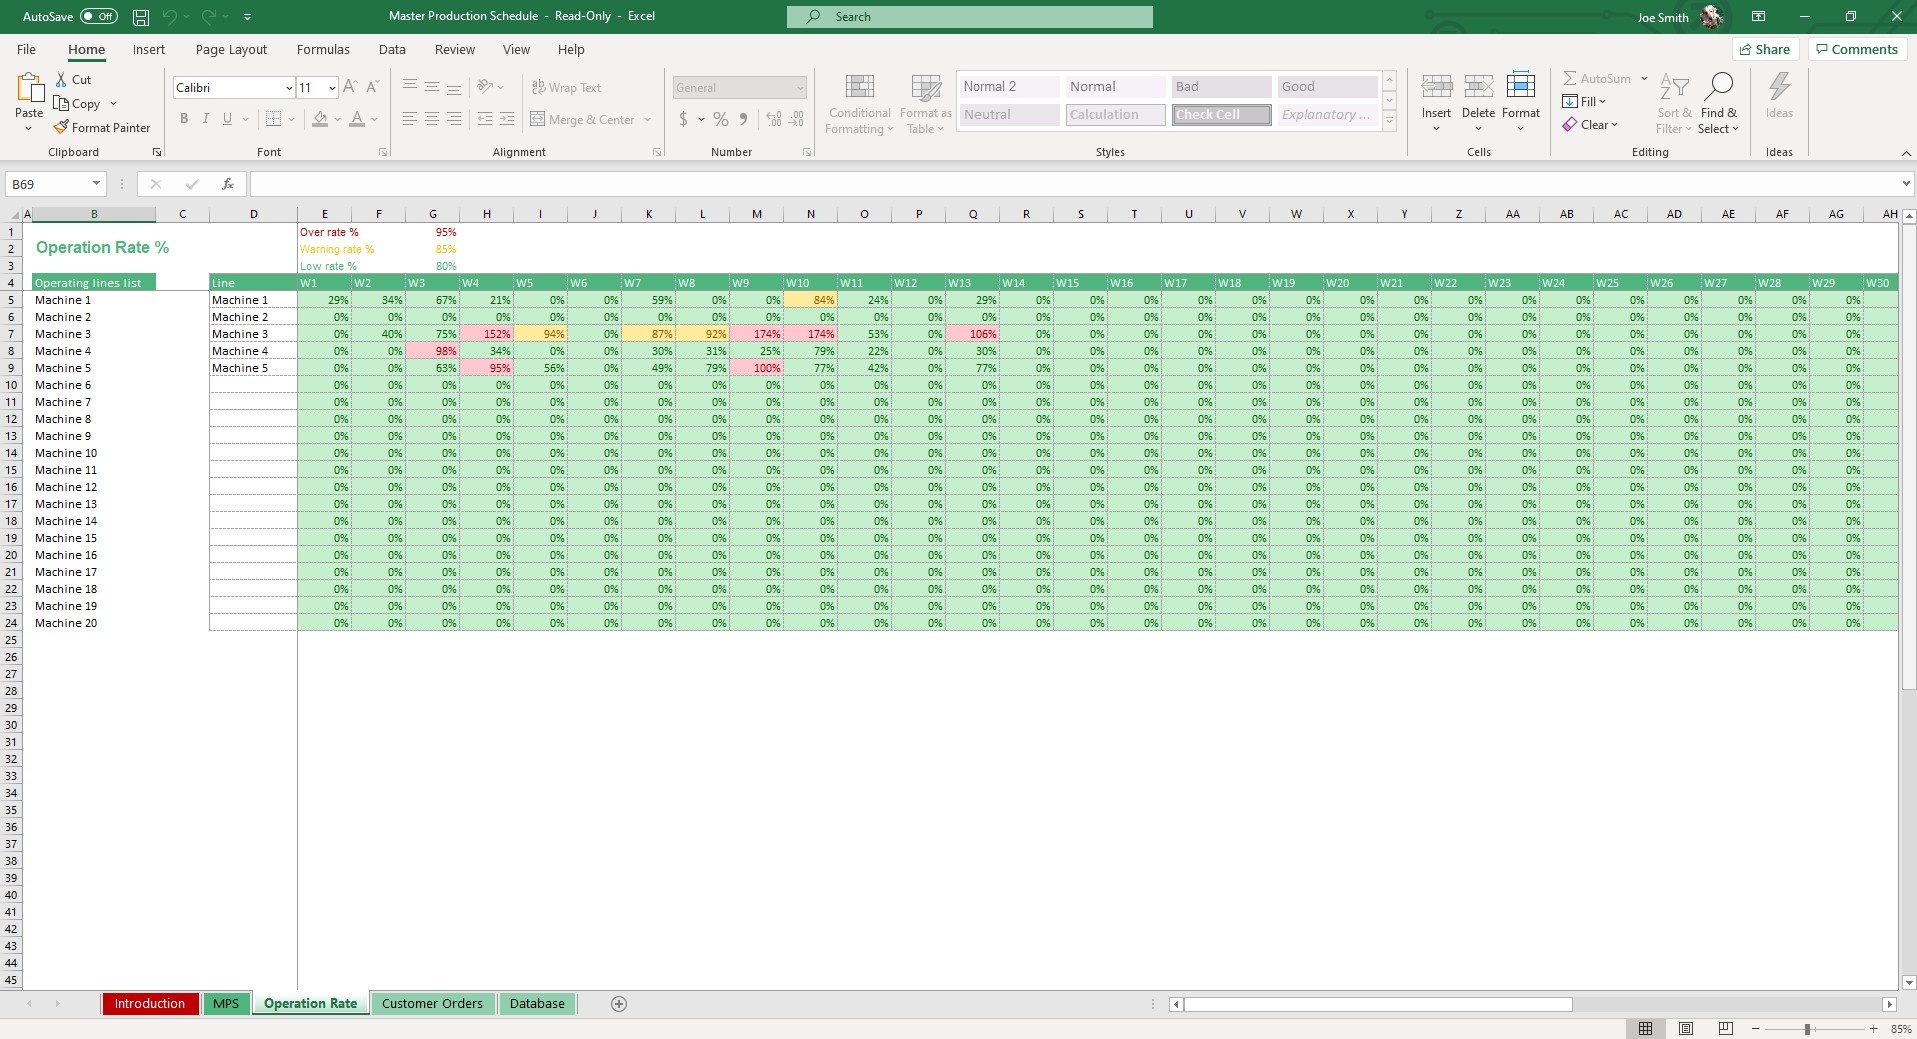
All of that data will carry over to the Operation Tab where the operating line capacity will calculate automatically. Conditional formatting will highlight the operation rate percentage based on the percentage limits of. The placeholder for Over Rate % is 95%, Warning Rate is 85% and Low Rate 80%. Adjust these to organizational standards as it will alert you to any anomalies in operation rate.
And just like that, you’ve completed a Master Production Schedule. Your orchestra can now produce beautiful and precise music.
If you find this template useful, you may also want to check out our Capacity Analysis, Cost of Quality, Bill of Materials and Manufacturing KPI templates. We have dozens of templates designed to help supply chain and operation professionals take their operation and efficiencies to the next level.
MPS vs Production Plan vs Detailed Schedule
Production planning happens at three levels, and the master production schedule sits in the middle. Confusing the three is the most common reason teams either over-plan (scheduling at a level of detail they can't maintain) or under-plan (committing to customer dates the shop floor can't actually hit).
The production plan is the highest level: aggregate quantities by product family, usually in monthly or quarterly buckets. It answers "roughly how much do we need to make next quarter?" and is owned by sales-and-operations planning. The master production schedule drops down to the SKU level in weekly buckets — specific products, specific quantities, specific weeks. The detailed (shop-floor) schedule goes further still: individual operations sequenced by hours or shifts on specific lines, owned by the production supervisor.
| Level | Detail | Time bucket | Owner |
|---|---|---|---|
| Production Plan | Product family / aggregate | Months / quarters | S&OP / leadership |
| Master Production Schedule | Individual SKU | Weeks | Master scheduler |
| Detailed Schedule | Operation / machine | Hours / shifts | Production supervisor |
A production plan template is the right tool when you're forecasting capacity needs months out and don't yet know the exact SKU mix. The MPS is where that aggregate plan becomes a real, buildable, week-by-week commitment. This template lives at the MPS level: you select products into the schedule, and fields like operating line, lot size, and capacity populate automatically from your database so the weekly plan stays grounded in what the lines can actually produce.
Calculating Available to Promise (ATP)
Available to Promise is the number your salespeople should quote to customers — and it's almost never the same as the inventory figure sitting in your system. Raw inventory tells you what's on the shelf right now. ATP tells you what's genuinely free to sell once you account for production already coming and orders already committed to other customers.
The calculation is straightforward:
ATP = beginning inventory + scheduled production − committed customer orders
Here's a worked example for a single product across three weeks. Say you start Week 1 with 200 units on hand. Your MPS has 500 units scheduled to come off the line in Week 1, and customers have already committed to 400 units that week. Your ATP for Week 1 is 200 + 500 − 400 = 300 units — that's what a salesperson can safely promise without overbooking. Carry the 300 forward, add Week 2's scheduled production of 500 and subtract Week 2's committed 450, and you have 350 available entering Week 3. The point is that the only safe number to promise a new customer is ATP, not the 200 units you happen to see in stock today — those are already half-spoken-for.
Quoting raw inventory is how businesses end up promising the same units to two customers and then scrambling. The MPS sheet in this template projects ATP automatically across every period in your schedule, so the available figure updates the moment you log a new order or adjust planned production — no manual recalculation, and no double-booking.
Capacity Planning with Cycle Time and Efficiency
Every realistic production schedule has to answer one question before it commits to a delivery date: can the line actually produce that many units in the time available? That comes down to two inputs you already track — cycle time and efficiency — and a small amount of arithmetic the template handles for you.
Start with throughput per hour:
Units per hour = (60 ÷ cycle time in minutes) × efficiency %
Then daily capacity:
Daily capacity = working hours per day × units per hour
A worked example. Suppose a product has a cycle time of 4 minutes, the line runs at 90% efficiency, and you operate an 8-hour shift. Theoretical throughput is 60 ÷ 4 = 15 units per hour. Apply the 90% efficiency factor and you get 13.5 effective units per hour. Over an 8-hour shift that's 13.5 × 8 = 108 units per day — not the 120 the theoretical rate would suggest. That 12-unit gap is exactly the kind of optimism that wrecks a schedule when it's repeated across a week.
The efficiency factor matters because no line runs at 100%: changeovers, minor stoppages, and quality holds all eat into the theoretical rate. Building efficiency into the capacity calculation is what separates a schedule the floor can hit from one that looks good in the spreadsheet and slips in reality.
Capacity planning also surfaces your bottleneck — the line or operation with the lowest effective output. Your whole schedule can only move as fast as that constraint, so it's the first place to look when you need more throughput. This template's Operation Rate sheet applies conditional formatting to flag when a line crosses 85% (warning) or drops toward 80% utilization, so an emerging bottleneck shows up before it turns into a missed customer date.
Connecting MPS to Bill of Materials and Inventory
A master production schedule doesn't operate in isolation — it's the trigger for everything that has to be bought and built underneath it. The link between them is your bill of materials.
The logic is simple: MPS quantity × BOM components = raw material requirements. If the MPS calls for 500 finished units and each unit's bill of materials lists 4 of a given component, you need 2,000 of that component on hand before the run. Multiply that across every component and every scheduled product, and you've derived your total material requirements for the period. This is the core idea behind MRP (Material Requirements Planning): the production schedule drives material demand, rather than guessing at it.
Those requirements then feed two downstream decisions. First, inventory: compare required components against what's already in stock to find the shortfall. An inventory management template tracks on-hand quantities and reorder points so the gap is obvious. Second, timing: shortfalls become purchase orders, and the lead time on those orders dictates how early you have to commit. A purchase order template turns each shortfall into a tracked order to the right vendor. Run together, the MPS, BOM, inventory, and PO layers form a tight loop — the schedule tells you what to build, the BOM tells you what it takes, inventory tells you what's missing, and the PO closes the gap in time for the run.
Frequently Asked Questions
What is a master production schedule (MPS)?
A master production schedule (MPS) is a plan showing what products will be produced, in what quantities, and when — typically over a 4-12 week horizon. It bridges demand forecasts and capacity planning, driving downstream activities like procurement (via the BOM) and shop floor scheduling.
What's included in this MPS template?
Four integrated tabs: Database (your operating standards — cycle time, working hours, lot sizes per product/line), Custom Orders (confirmed customer demand), MPS sheet (the schedule itself with auto-calculating capacity/ATP), and Operation Rate (capacity utilization with warning thresholds).
Does it calculate Available to Promise (ATP)?
Yes. ATP = projected inventory available to commit to new orders, calculated as: beginning inventory + scheduled production − committed orders. The MPS sheet shows this rolling forward week by week.
Can it warn me about capacity overload?
Yes. The Operation Rate sheet uses conditional formatting to flag your utilization: Warning Rate at 85% and Low Rate at 80%. Above 85% means you're running hot and have little slack for surprises.
Does this work for make-to-stock and make-to-order?
Yes — both models. Make-to-stock uses forecasts to drive production targets. Make-to-order uses confirmed customer orders. Toggle the mode in the database, or use both side-by-side.
How does this connect to a Bill of Materials?
The MPS specifies what to produce; the BOM specifies what each product is made of. Link them by exporting MPS quantities and multiplying by BOM components to project raw material needs. We have a Bill of Materials template that pairs with this.
Does it work in Google Sheets?
Yes — both Excel and Google Sheets versions are included.
Professional Master Production Schedule Template for Excel & Google Sheets
Who is this Production Sheet Template For?
Whether you are running a small workshop or managing a large manufacturing floor, this production schedule template is designed to adapt to your needs.
| Role | Primary Use Case |
|---|---|
| Supply Chain Managers | Tracking Availability to Promise (ATP) and balancing projected inventory against customer orders. |
| Operations Directors | Monitoring line capacities and utilizing conditional formatting to spot low-efficiency warning rates. |
| Production Planners | Establishing minimum lot sizes, cycle times, and working day requirements without paying for expensive SaaS tools. |
Expert Walkthrough: How it Works
Unlike a basic, static production schedule template, our tool uses a multi-sheet database to automate the heavy lifting for you:
- Step 1: Set Your Baseline (Database Sheet). Record organizational standards including Product Name, Operating Line, Cycle Time, Efficiency %, Units Per Hour, Working Hours Per Day, and Minimum Lot Size.
- Step 2: Log Demand (Custom Orders Sheet). Record all confirmed customer orders along with their corresponding dates and quantities.
- Step 3: Generate the Schedule (MPS Sheet). Select products to add to your schedule. Fields like Operating Line, Lot Size, and Capacity update automatically based on prior inputs. Add your projected stock and required production quantities to cover orders.
- Step 4: Monitor Capacity (Operation Rate Sheet). Data carries over automatically. Conditional formatting highlights your operation rate percentage (e.g., Warning Rate at 85%, Low Rate at 80%) to alert you to any anomalies instantly.
Why Use a Production Schedule Excel Template?
This excel production schedule template features dynamic filters that allow you to preview your Master Production Schedule, custom orders, and most importantly, your ATP (Availability to Promise—the projected inventory you actually have available to sell).
And just like that, you’ve completed an accurate master schedule. Your "orchestra" can now produce beautiful and precise music without the fear of bottlenecks.
If that wasn't enough reason to get this excel template production schedule, it is also completely compatible with Google Sheets! Collaborate with your co-workers on the factory floor in real-time and enjoy cloud auto-save functionality.
Frequently Asked Questions
Is this a one-time purchase or a software subscription?
This is a one-time purchase. Avoid expensive monthly manufacturing software fees by downloading this template once and using it forever.
Is the template customizable for my specific manufacturing lines?
Yes. You can easily adjust the placeholder warning rates (like the 95% Over Rate or 80% Low Rate) to match your organization's specific performance standards.
Does this calculate my ATP (Availability to Promise)?
Absolutely. The template uses your projected stock and custom order inputs to automatically calculate the exact inventory you have available to promise to new customers.
More Operation Templates For You


Simple Pricing for Full Access
Unlock full access to the entire library for one low price.
