
Affinity Diagram
Excel Template
What's Inside the Affinity Diagram Template?
Details | 2 Sheet
Supported Versions | Excel 2010, 2013, 2016, 2019, Office 365 (Mac)
Category | Project Management, Management
Tags | Brainstorming, Notetaking, Innovation
Why Professionals Choose Simple Sheets
It's simple. Access to the largest library of premium Excel Templates, plus world-class training.

100+ Professional Excel Templates
Optimized for use with Excel. Solve Excel problems in minutes, not hours.

World-Class Excel University
With our university, you'll learn how we make templates & how to make your own.

How-To Videos
Each template comes with a guide to use it along with how-to videos that show how it works.
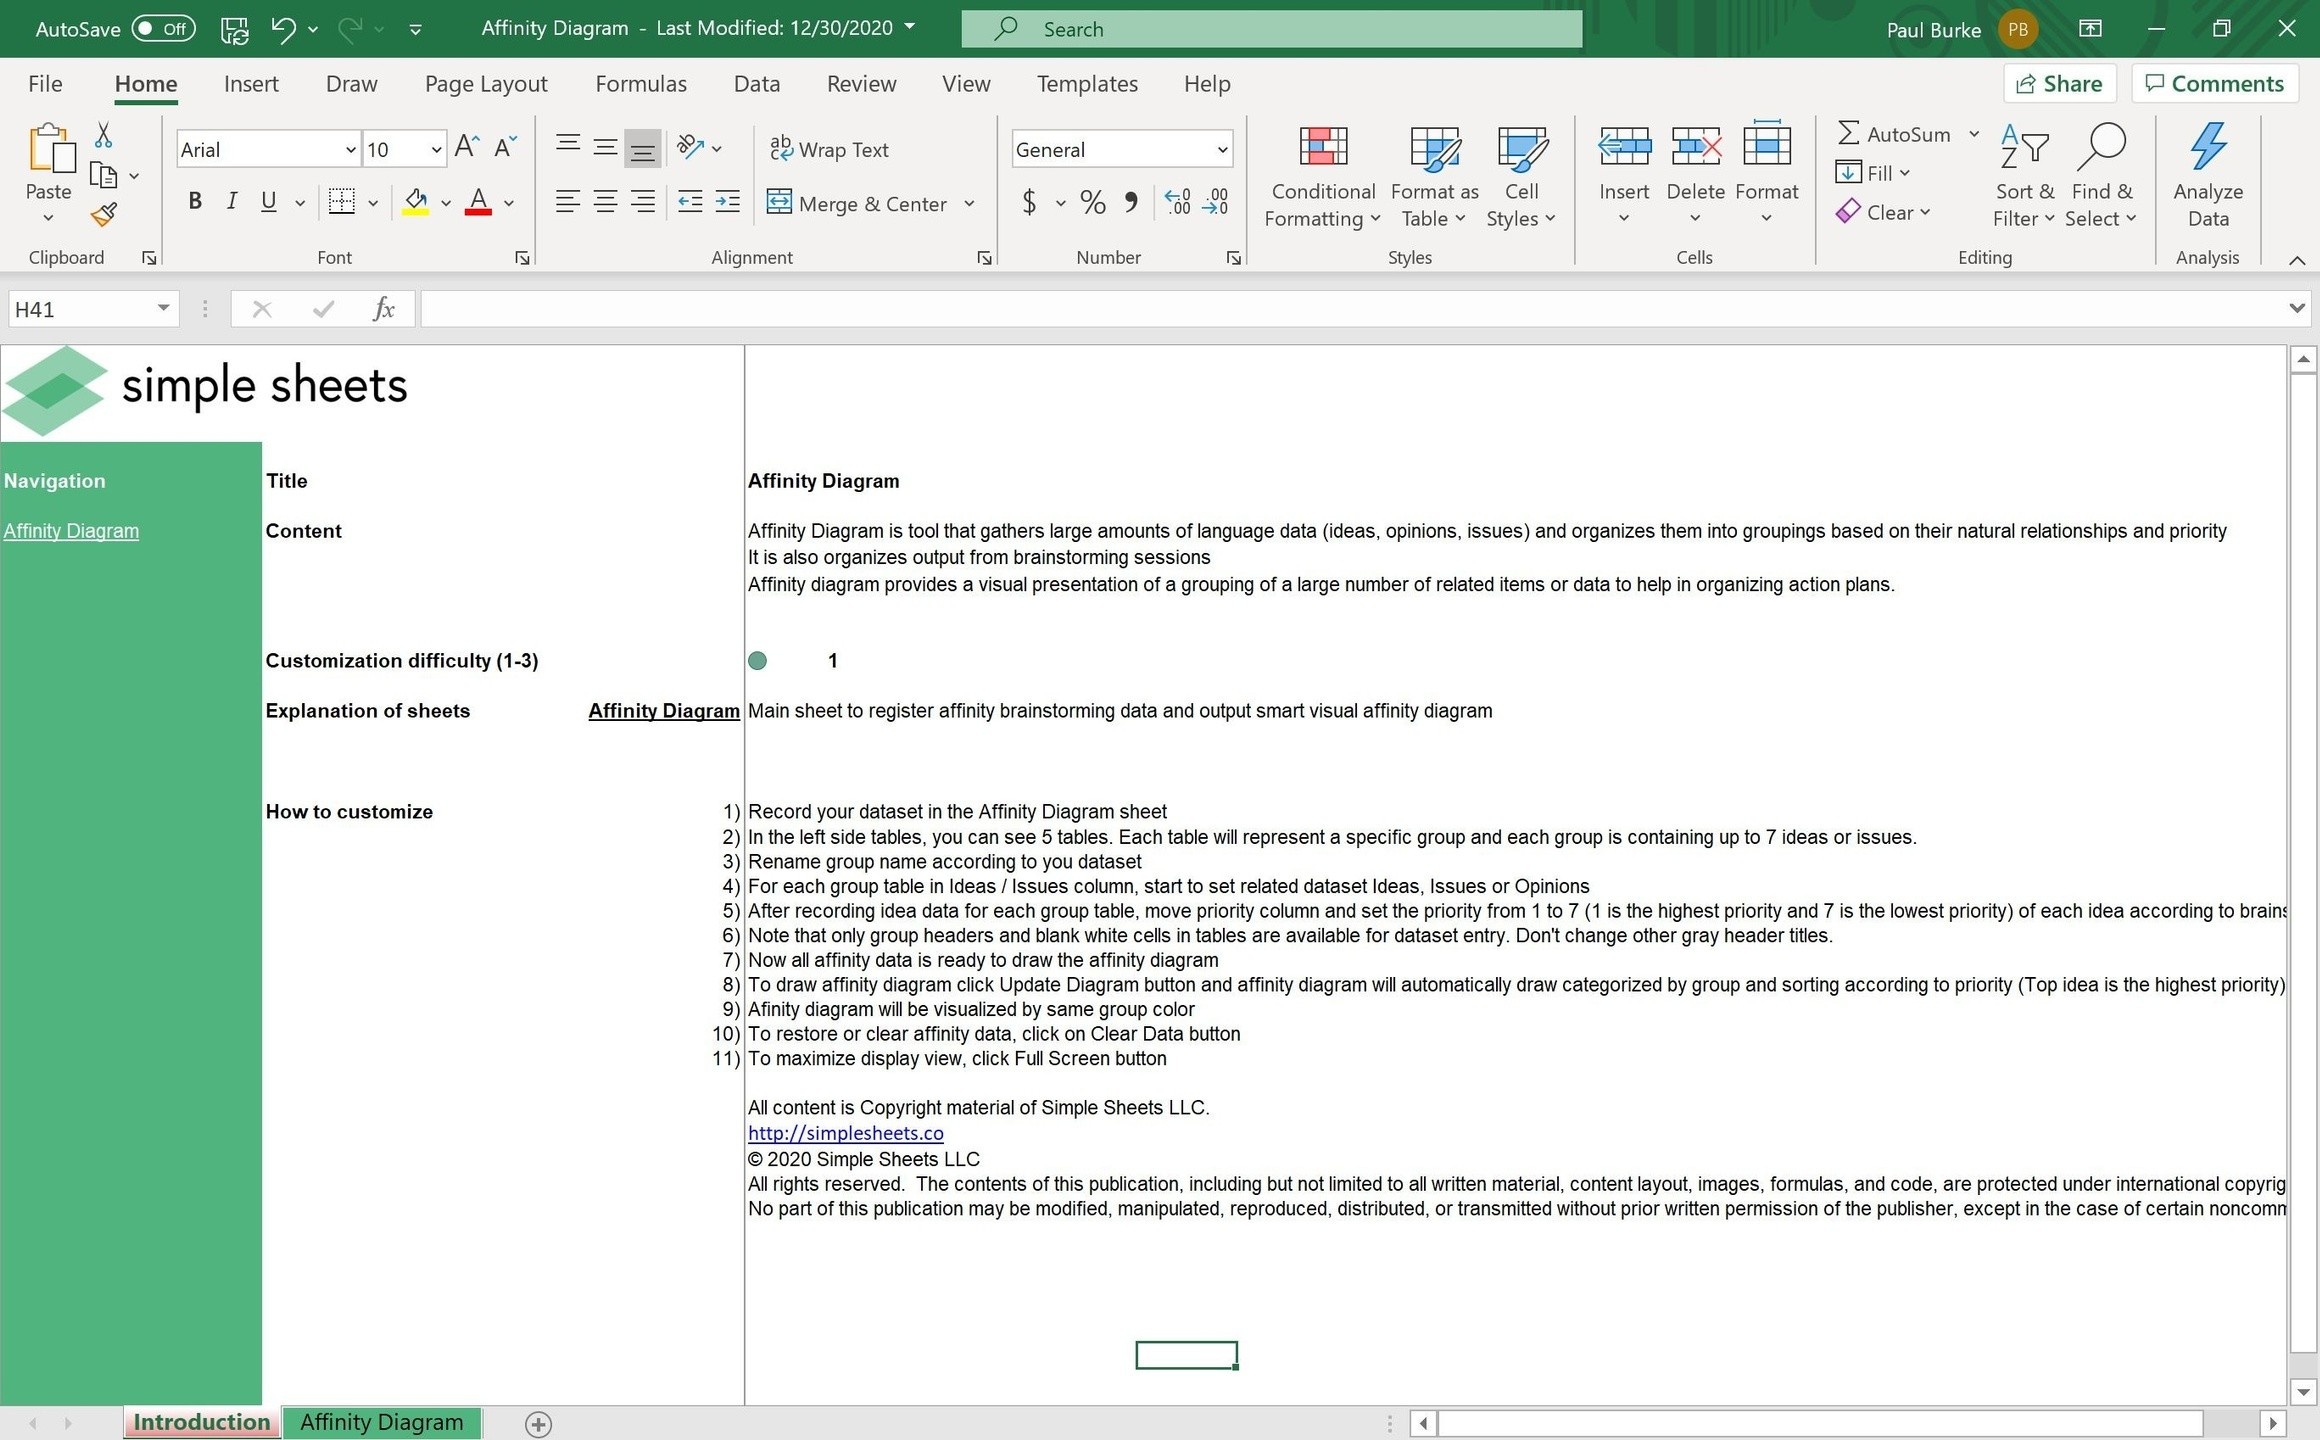
Inside Our Affinity Diagram Excel Template

A brainstorming session can go one of two ways. Either it can be a complete waste of time with no accountability or follow up, or it can be a catalyst to major innovation and growth. Part of achieving the latter is the constraint of note-keeping.
That’s where our Affinity Diagram Excel Template comes in handy. It makes it easy to record, categorize and organize ideas or issues from brainstorming.
Before we get into our tutorial of how to use it, you may also find other project management templates like our PDCA or Kanban Board highly useful.
Let’s dive into how to use this spreadsheet.
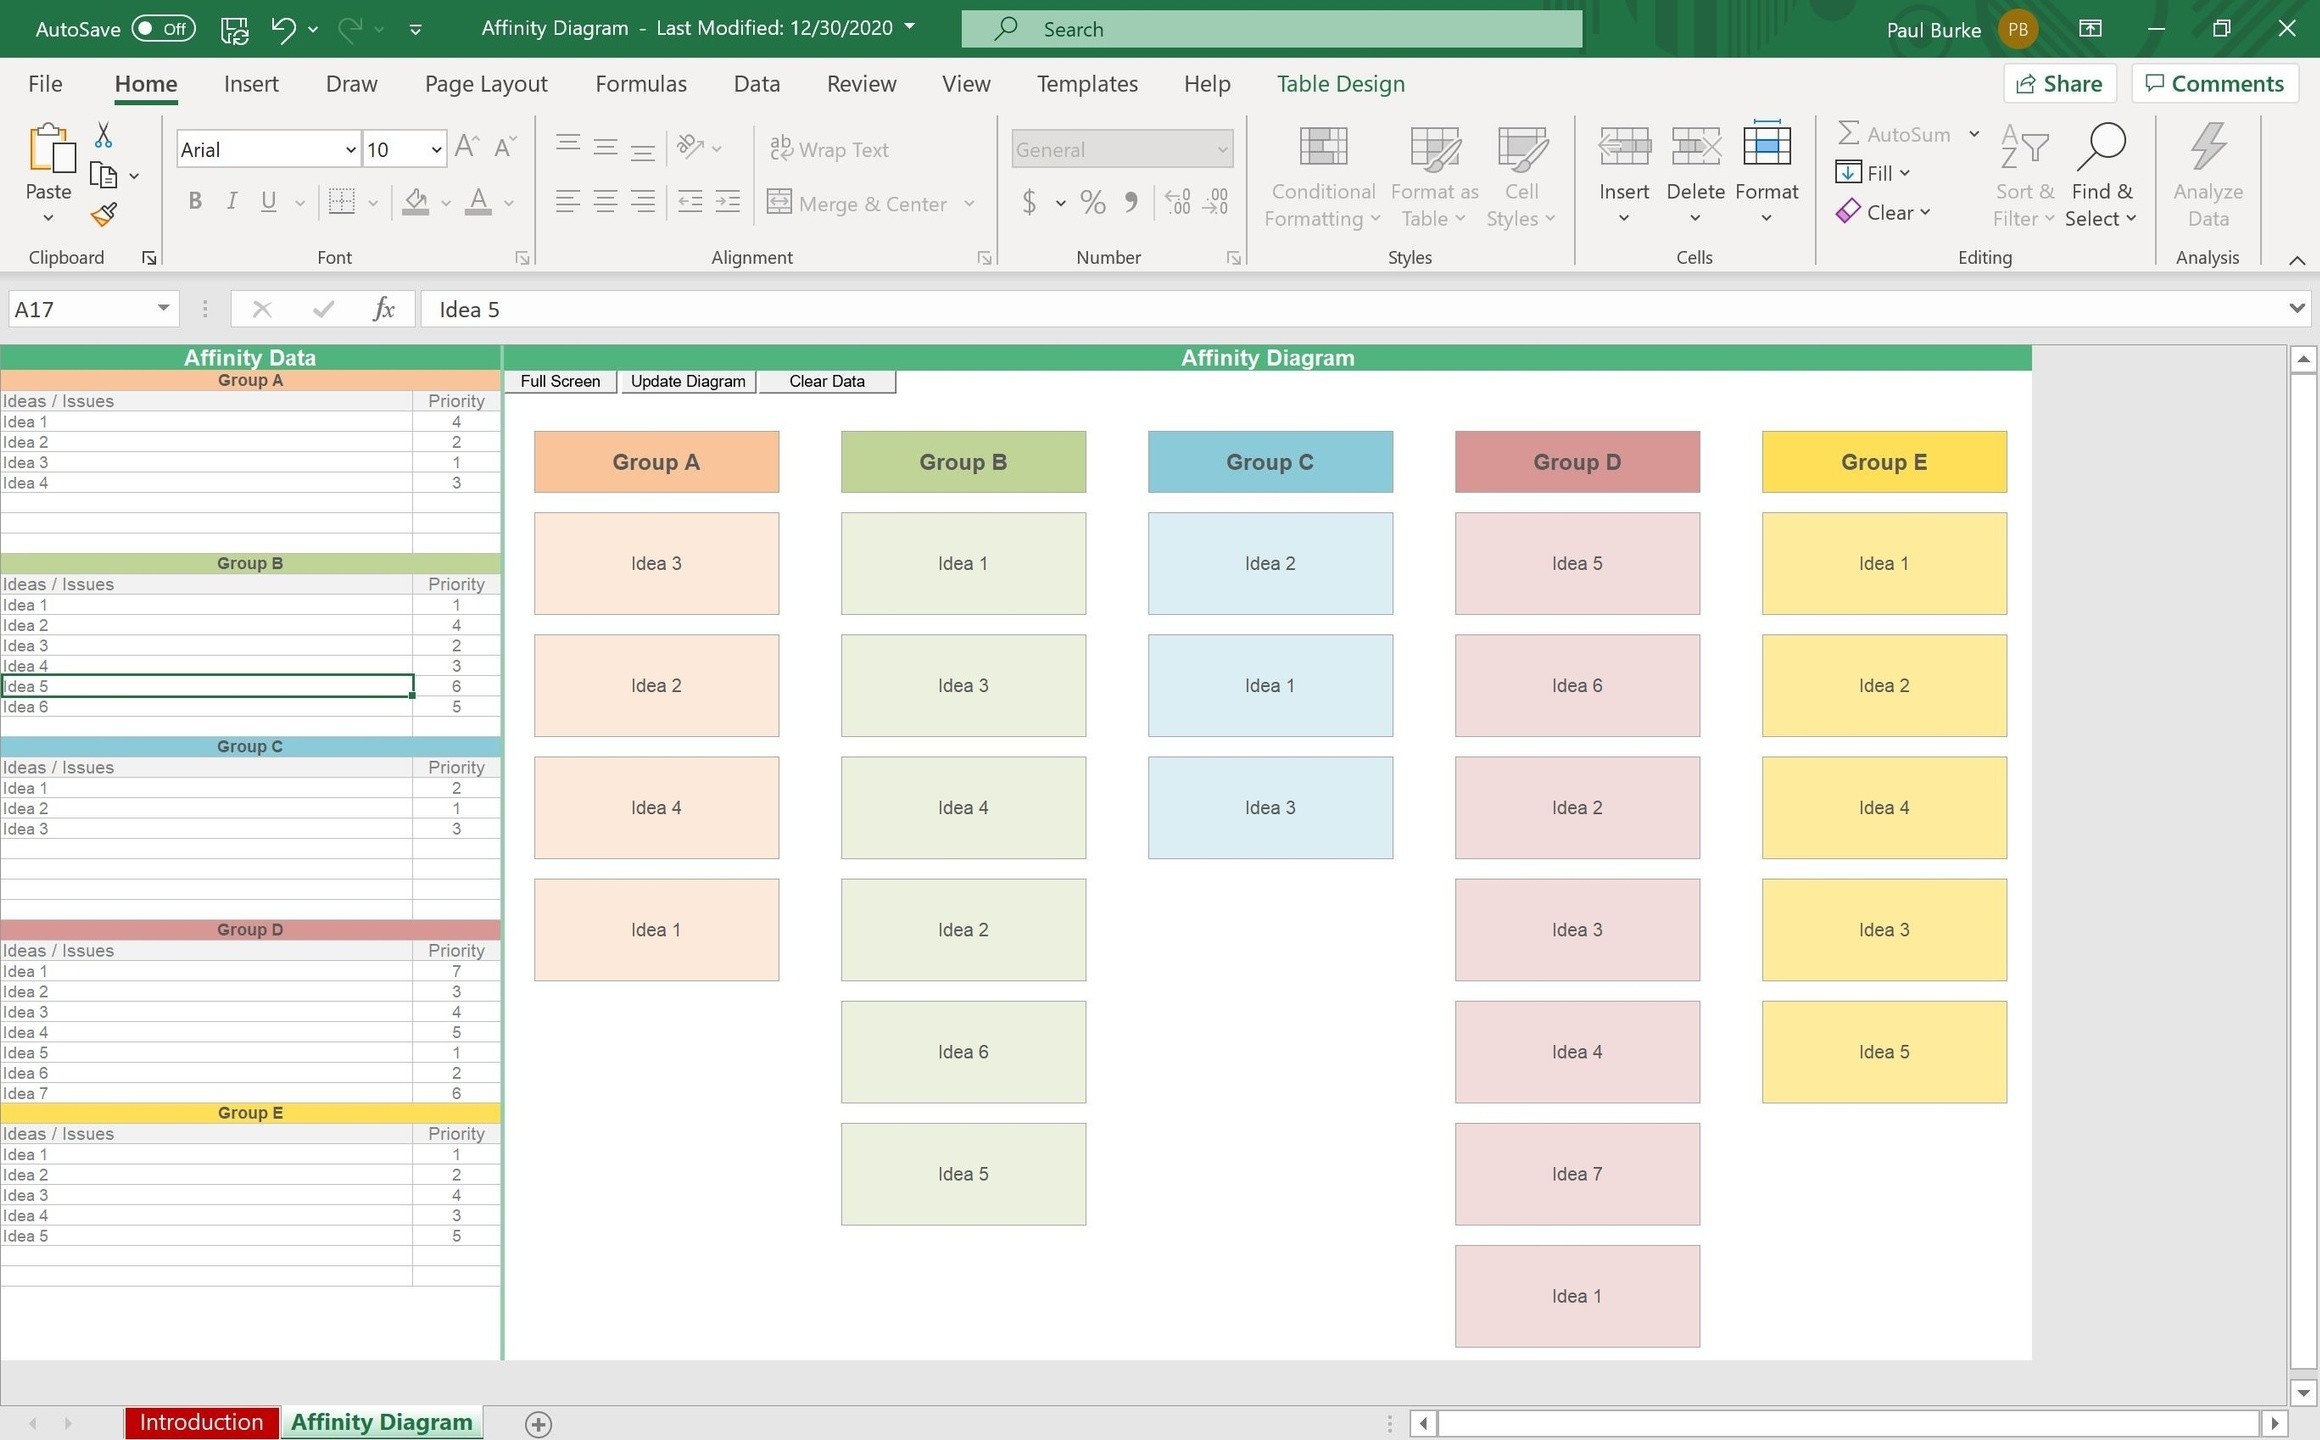
Start by recording your dataset in the Affinity Diagram sheet. On the left side of the sheet are 5 tables. Each table will represent a specific group or category. Currently, the placeholders are Group A, B and so on. Rename them as you see fit with new product, marketing or sales ideas (the list goes on and on, but those are a few use-cases.). You can insert up to 7 issues into each category.
After recording ideas for each category, select the priority on a scale of 1 to 7 with 1 as the highest priority and 7 as the lowest priority.
To draw the affinity diagram, click the Update Diagram button. It will automatically categorize and prioritize ideas (illustrated by cards) by your inputs.

To make it easy on the eyes, the diagram will be the same color as it is in the table.
Ready for your next brainstorming session? Save the file with the date and click Clear Data to start from scratch. Ready to share your ideas and priority with the team? Click Full Screen for presentations and easy viewing.
Affinity Diagram is a great tool for project managers, strategists and teams looking to incorporate six sigma practices into their processes.
More Project Management Templates For You


