
How To Insert Scatter Charts In Excel From Different Sources
May 04, 2023
Are you looking for a way to incorporate scatter charts into your Excel spreadsheets from other sources?
IScatter charts can help you visualize and compare data in an easy-to-understand format, making them invaluable components of many spreadsheet projects. This blog post will provide detailed instructions to easily insert scatter charts into Excel.
Get our free Excel formulas cheat sheet
Plus new tutorials and template drops. Enter your email and we'll send it over.
Read on as we cover the following:
-
What is a Scatter Chart?
-
Different Ways to Insert Scatter Charts in Excel
-
The Benefits of Inserting a Scatter Chart in Excel File Format.
-
Final Thoughts on How To Insert Scatter Charts In Excel
-
Frequently Asked Questions on How To Insert Scatter Charts In Excel

What is a Scatter Chart?
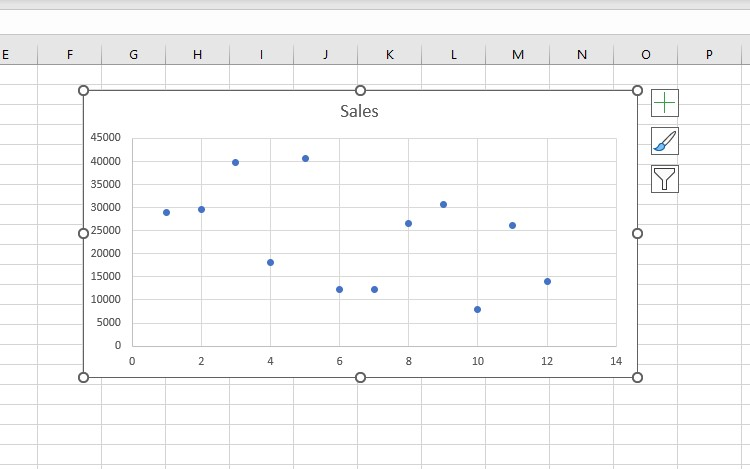
A scatter chart, an XY graph, or a scatter plot displays the correlation between two variables on a two-dimensional chart.
A scatter graph shows numeric values on both horizontal and vertical axes. Generally, the independent variable is on the x-axis or the horizontal axis, and the dependent variable is on the y-axis, which is the vertical axis. The graph represents data points at the intersection of the x and y axes.
A Scatter plot is primarily for displaying the correlation level between two variables. A stronger correlation means that the data points closer to a straight line.
Different Ways to Insert Scatter Charts in Excel
If you have Scatter Charts outside of Excel, you can insert them in the following ways:
Method 1: Insert a Scatter chart from the files.
If you have a Scatter chart downloaded from a website or application, especially from a Scatter diagram generator, follow the steps below to insert a Scatter chart from your files:
-
Open your Microsoft Excel application.

-
Click Blank workbook.
-
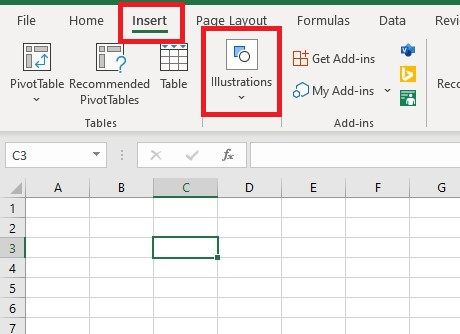
Go to the Insert Tab and click Illustrations.
-
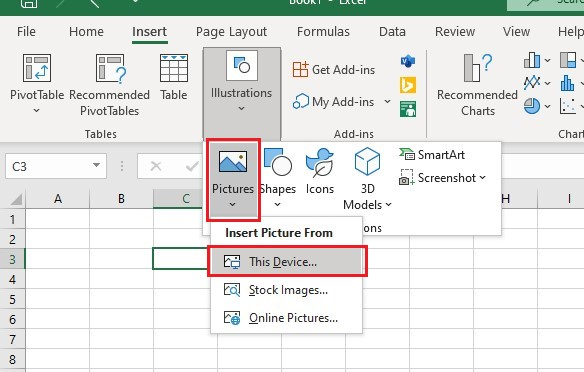
Click Pictures and the "This Device" option in the Illustrations drop-down menu.
-
Locate the file location of your Scatter chart and click the Insert button.
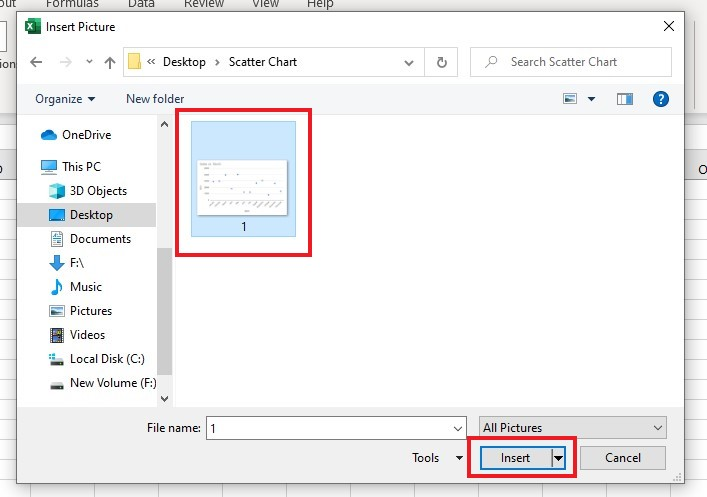
You now have successfully learned how to Insert Scatter charts from your files.
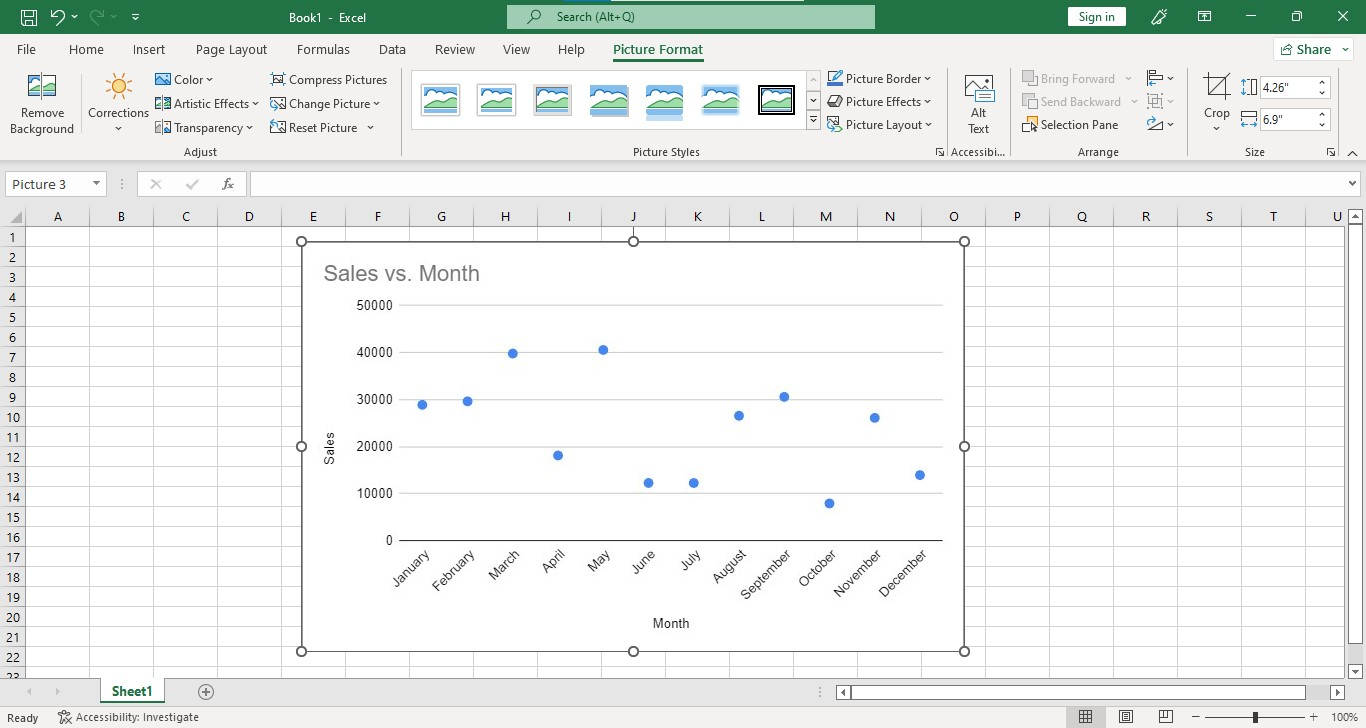
Note: The chart you've inserted from your files is not editable since it's a JPEG file or, in other words, in Picture Format, so you can't change its Chart Elements.
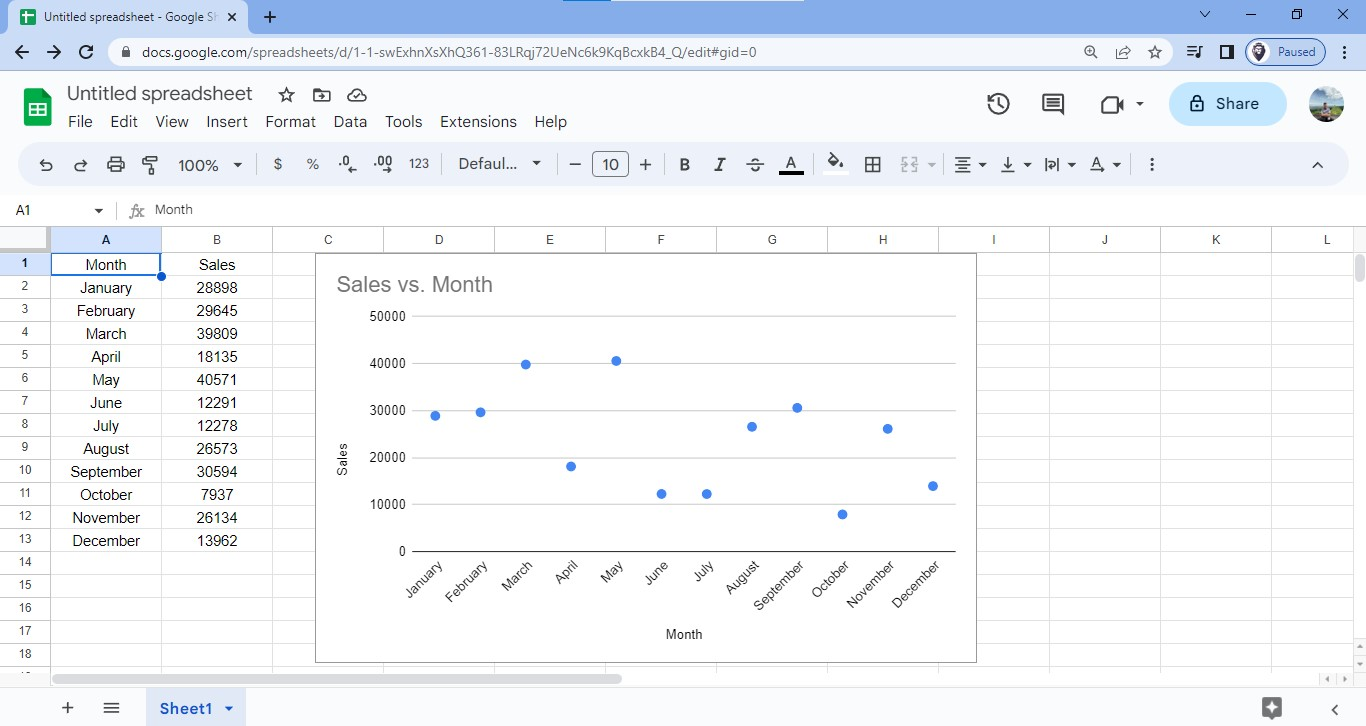
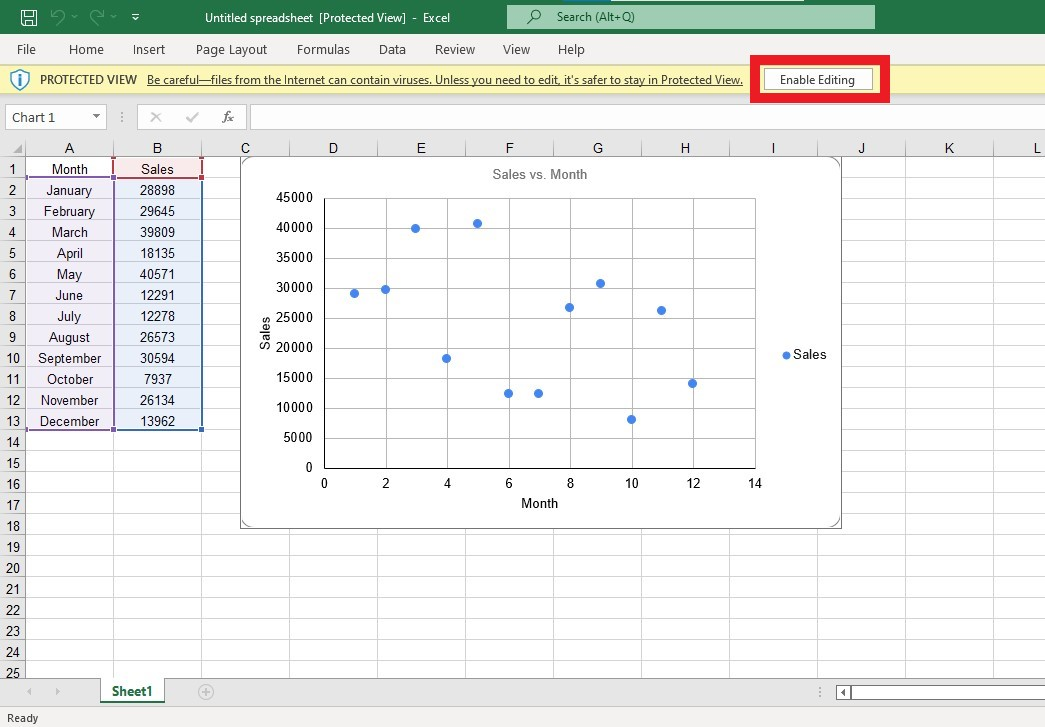
Method 2: Insert a Scatter chart from Google Sheets.
If you have a Scatter plot chart from Google Sheets then you want to insert is to Microsoft Excel, then follow these steps below :
-
Open your Google Sheets worksheets.
-
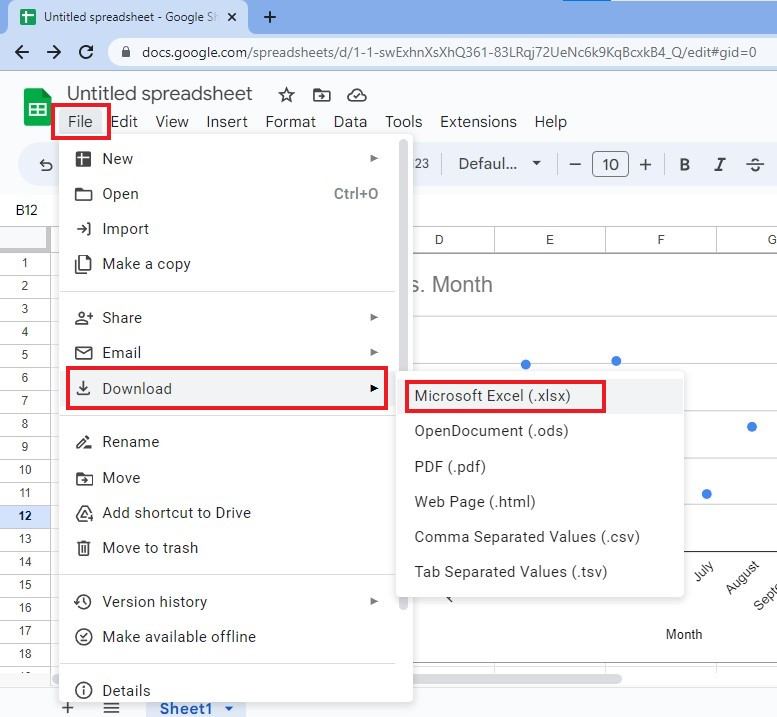
Go to the File tab, move your mouse to download, and click Microsoft Excel (.xlsx)
-
After downloading your Google Sheets Scatter chart in Microsoft Excel format, click the Open button.
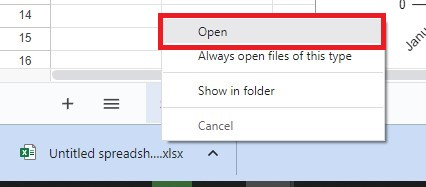
You've learned how to Insert Scatter charts from Google Sheets. If you want to edit your Scatter chart, click Enable Editing from the PROTECTED VIEW section in Excel.
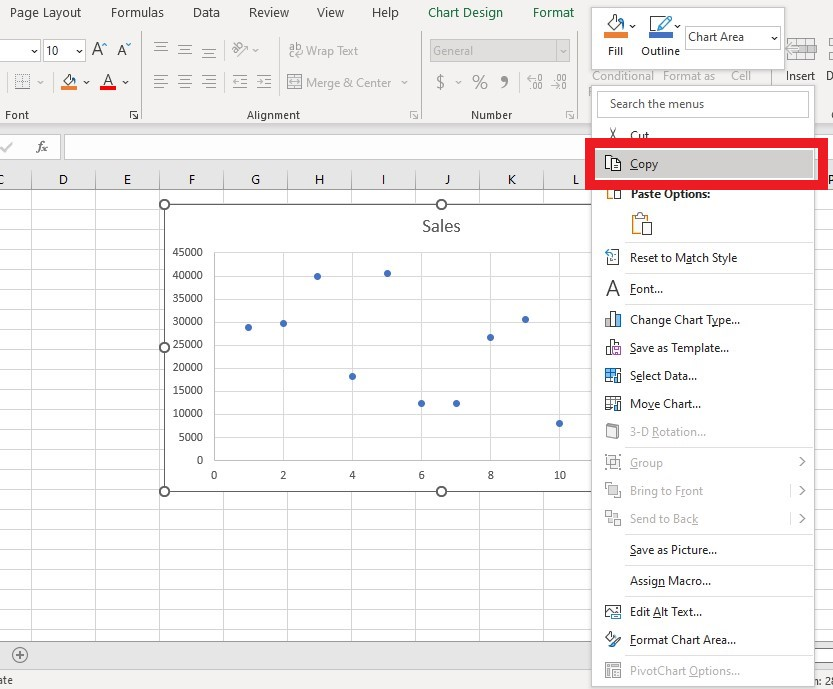
Method 3: Insert a Scatter Chart from another workbook.
If you want to Insert a Scatter chart from your other workbook, then follow the steps below:
-
Locate and Open your workbook with a Scatter plot in Excel.
-
Right-click your graph, then click the Copy button.
-
Open your Microsoft Excel Application.
-
Click Blank workbook.

-
Press the CTRL+V keys to paste the Scatter chart into your Excel workbook.
Follow each step above carefully to insert a scatter chart from another workbook. Although it may seem challenging initially, it can become simpler with practice.
The Benefits of Inserting a Scatter Chart in Excel File Format.
Excel is one of the best-used data analysis and representation programs. When presenting data in graphical form, Scatter charts are unmatched in their ability to show trends and correlations between two variables.
Inserting a scatter chart in an Excel file format has several benefits, and these are the following:
-
You can choose other options from the Scatter Chart Types, like smooth lines, straight lines, and many more.
-
You can modify the data point in the bottom left quadrant.
-
You can change the Data labels or the Data points.
-
You can change the Axis Titles or the X and Y values.
-
You can change the Chart Title.
-
You can add a specific Chart Element.
-
You can change the appearance of your Scatter Chart from the Chart Design tab.
-
You can format the data source in the Select Data Source dialog box.
Final Thoughts on How To Insert Scatter Charts In Excel
Using scatter charts from other sources can add more context to your data. By inserting these charts into Excel, you can make immediate connections about relationships in your data that you wouldn't have seen without the chart.
Visit Simple Sheets for more easy-to-follow guides, and don't forget to visit the related articles section of this blog post. For the most straightforward Excel video tutorials, Subscribe to Simple Sheets on Youtube!
Frequently Asked Questions on How To Insert Scatter Charts In Excel
Why can't I drag my Scatter chart image into my Excel spreadsheet?
You can't drag a Scatter chart image because Excel does not allow dragging and dropping pictures from Windows Explorer directly onto a worksheet.
Is it only the Scatter charts I can insert a chart into my spreadsheet?
You may wonder if Scatter charts are your only option when adding a chart to your spreadsheet. The good news is that you can insert several charts, each with unique benefits.
Should I insert a scatter chart from other sources?
The answer depends on the credibility and reliability of the source. If the source is reputable and trustworthy, then it is worth considering.
Related Articles:
Easiest Guide: How To Make A Scatter Plot In Excel
Want to Make Excel Work for You? Try out 5 Amazing Excel Templates & 5 Unique Lessons
We hate SPAM. We will never sell your information, for any reason.

