
How To Insert Pie Charts In Excel: 3 Easy-To-Follow Methods
May 04, 2023
Are you looking for an easy way to insert pie charts in Excel from other sources?
If so, then this blog post is definitely for you! Pie charts are an excellent way to present large amounts of data using visuals. They give you the ability to compare information at a glance easily.
This blog post explains the process of inserting pie charts from external sources into Excel and highlights the advantages of doing so when creating reports.
Read on as we cover the following:
-
What are Pie Charts?
-
Different Ways To Insert Pie Charts In Excel
-
The Benefits of Insert a Pie Chart In Excel Format
-
Final Thoughts on How To Insert Pie Charts In Excel
-
Frequently Asked Questions on How To Insert Pie Charts In Excel

What are Pie Charts?
An Excel pie chart is a circular chart divided into pieces or slices. Each piece or slice in the pie chart represents a particular data value. Excel pie charts can also be beneficial when representing or visualizing data sets in percentage values out of a whole.
Read Also: Microsoft Excel Tutorial for Beginners
Different Ways To Insert Pie Charts in Excel
Microsoft Excel is a tool that allows users to create and analyze data easily. One of the most visually pleasing ways to present data is through a pie chart. There are several ways to insert a pie chart into Excel; they include:
Method 1: Create a pie chart using Microsoft Excel.
Follow the steps below to insert a pie chart in Microsoft Excel:
-
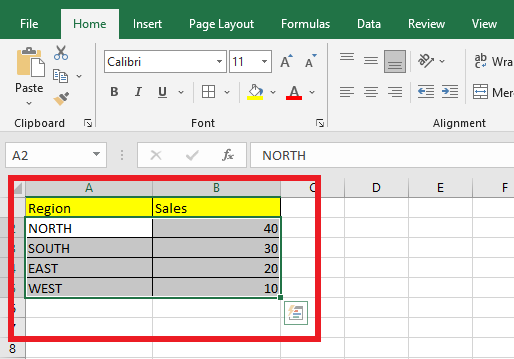
Select your data series or data set.
-
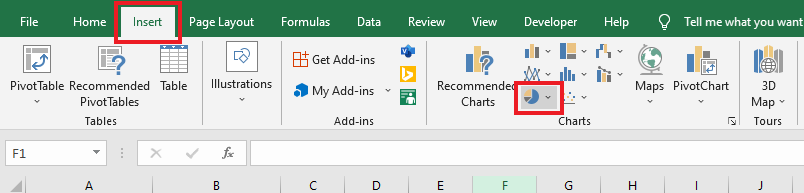
In the Excel Ribbon, navigate to the Insert tab, and click Insert pie chart.
-
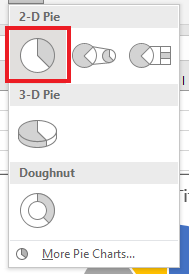
You can choose from different pie chart types in the Insert Pie or Doughnut Chart menu or click Pie Chart Icon.
-
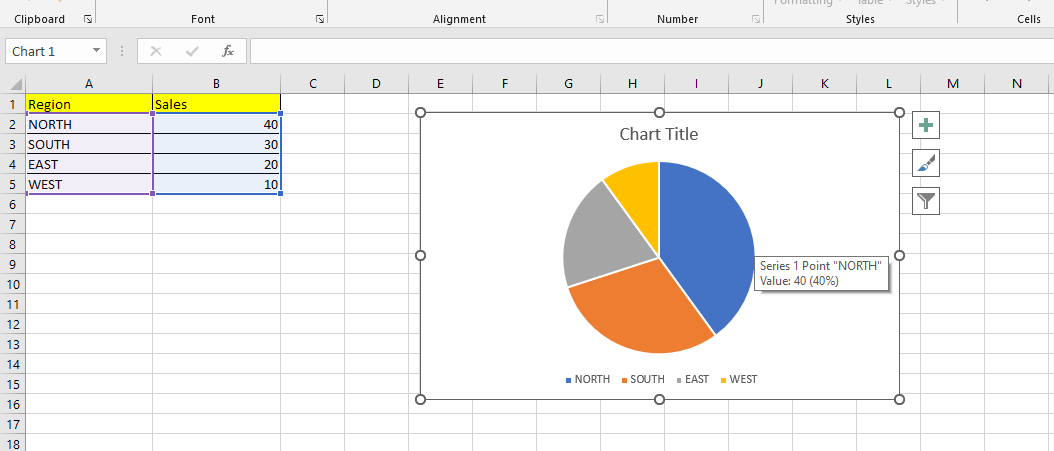
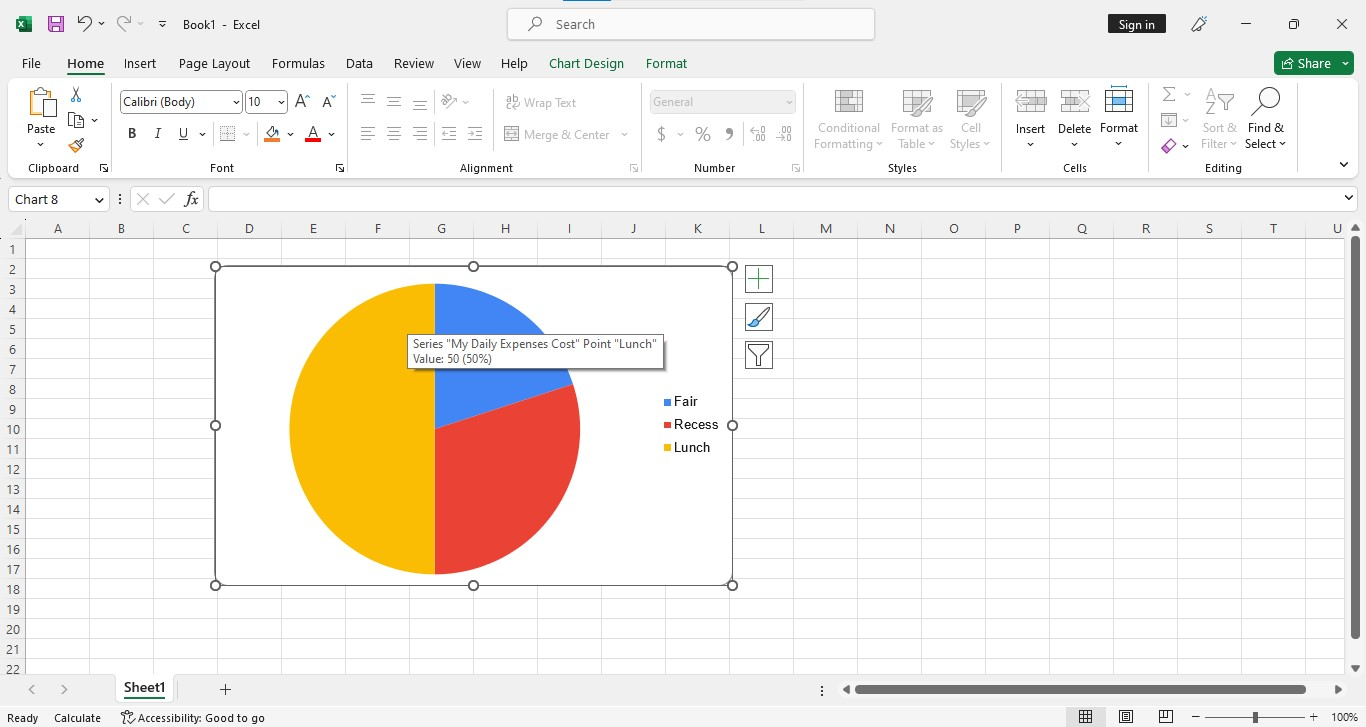
After selecting a pie chart type, Excel automatically inserts your simple pie chart into your spreadsheet.
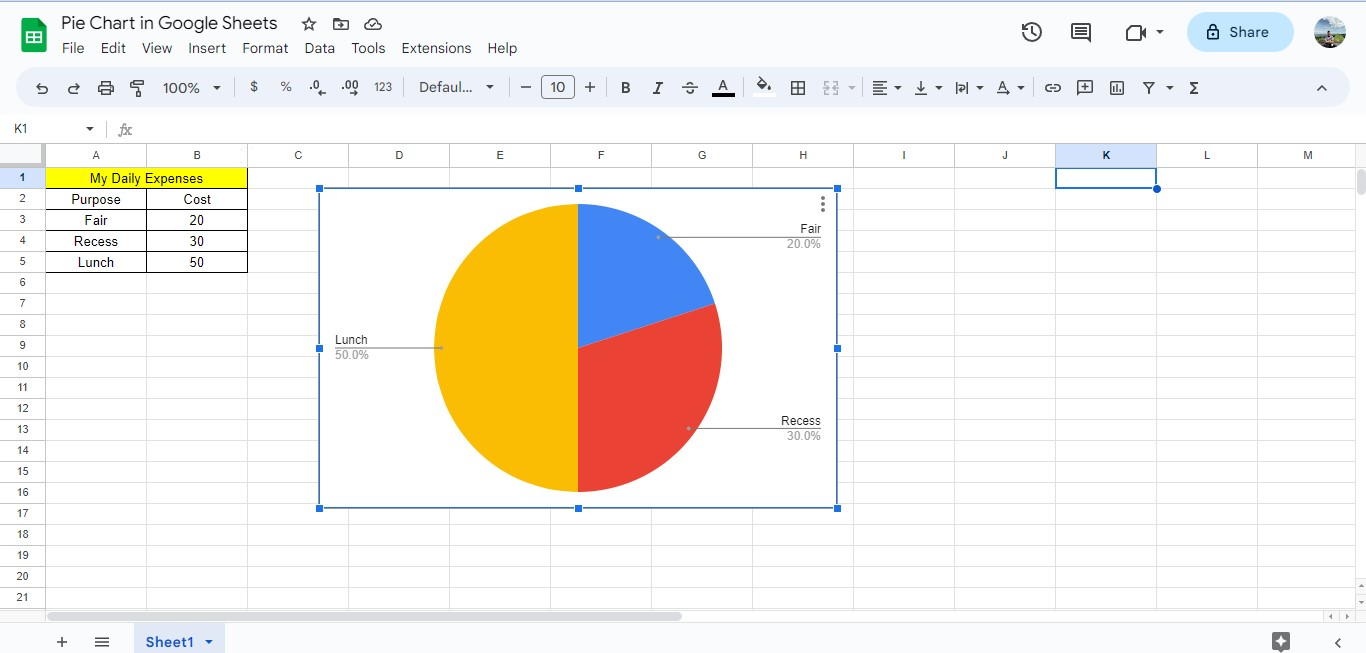
Method 2: Insert a pie chart from Google Sheets.
To insert a pie chart from Google Sheets, follow the steps below:
-
Open your Google Sheets and prepare your workbook with a pie chart.
-
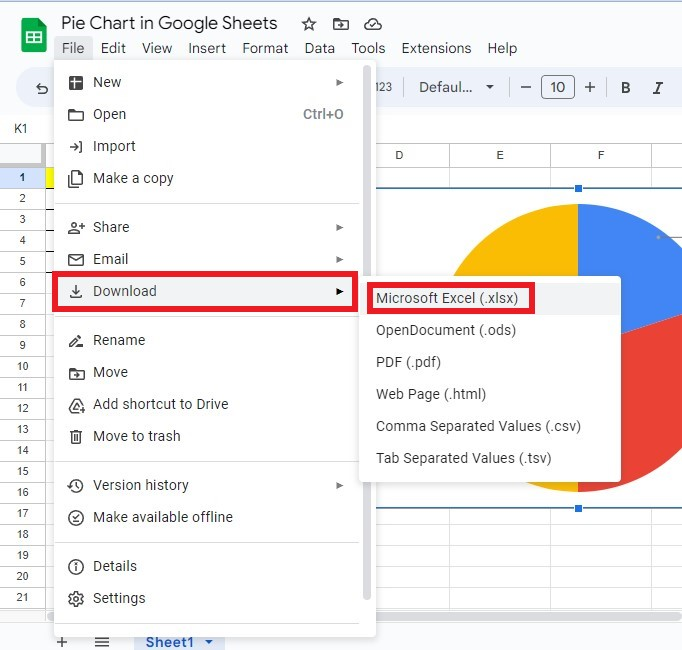
Click the File tab of Google Sheets, move your mouse to the download option, and select a file format.
-
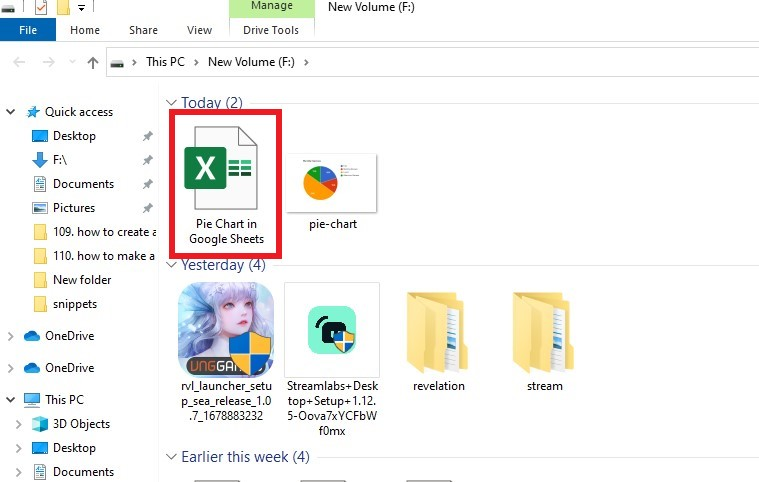
Locate your pie chart file from Google Sheets, and open the file.
-
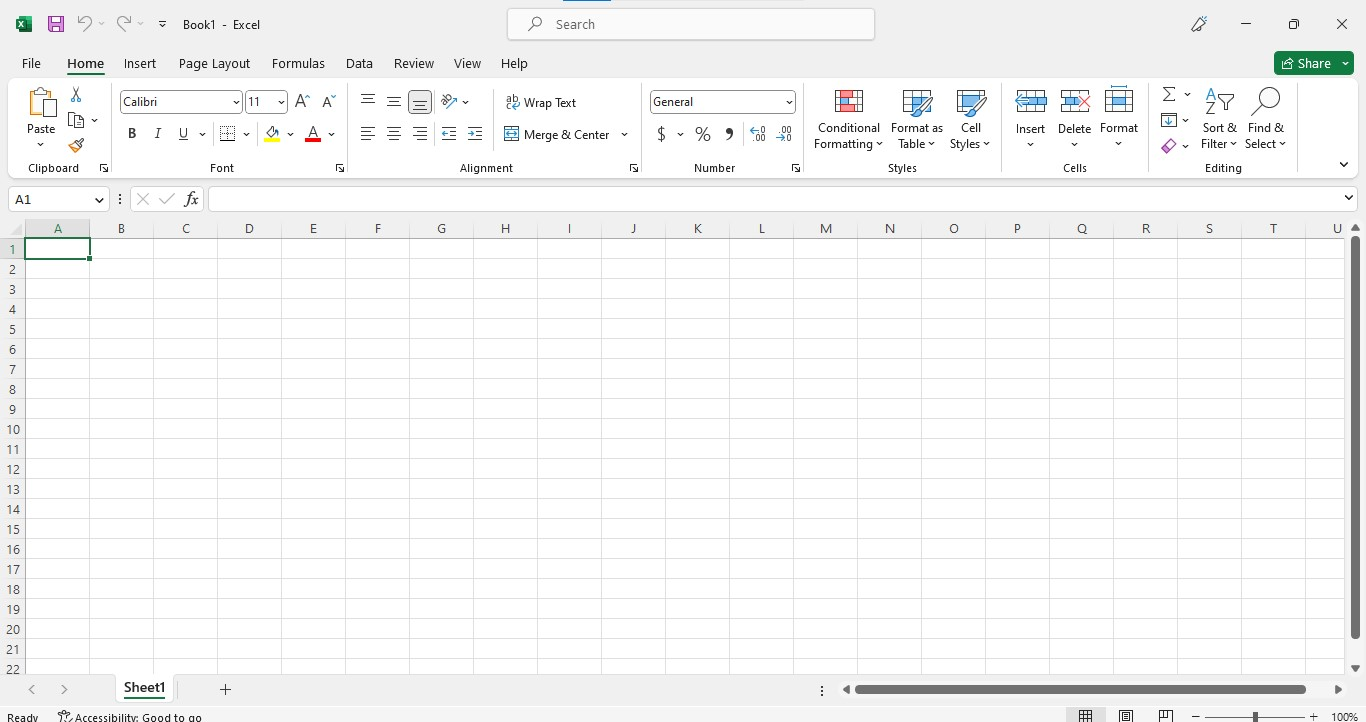
Open your blank workbook.
-
Right-click your pie chart from Google Sheets and click Copy.
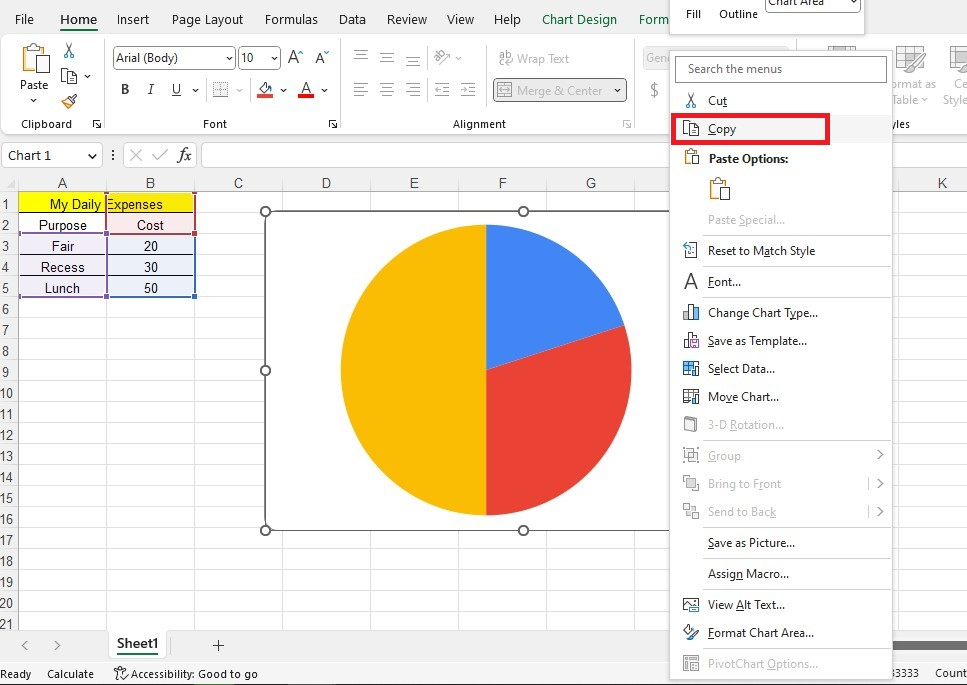
-
Paste your pie chart from Google Sheets to your Excel workbook.
Following the steps above, you can easily insert a pie chart from Google Sheets into your Excel workbook.
Method 3: Insert a pie chart from a Pie Chart Generator.
To insert a pie chart from a Pie Chart Generator into your Excel workbook, follow the steps below:
-
Open your Microsoft Excel.

-
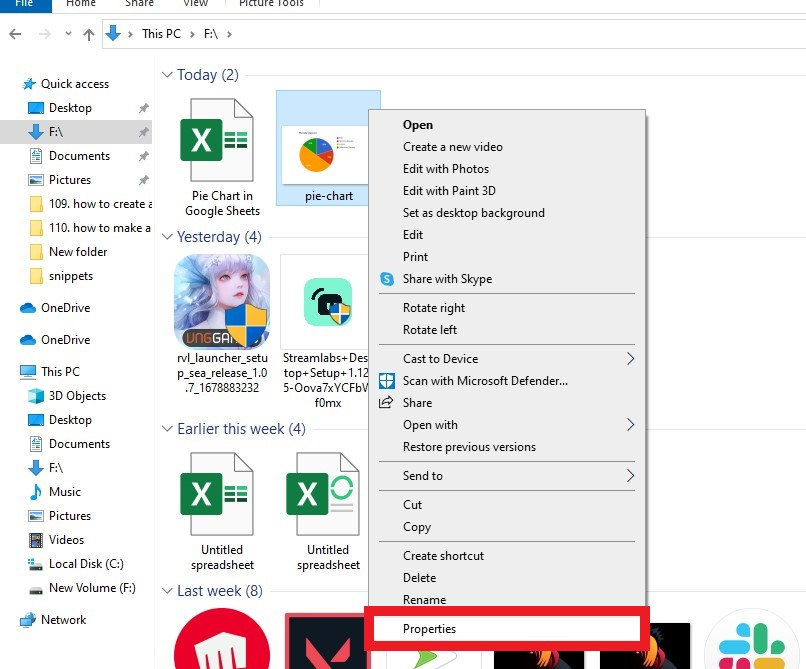
Locate your pie chart file location from a Pie chart Generator, then right-click the pie chart and select Properties.
-
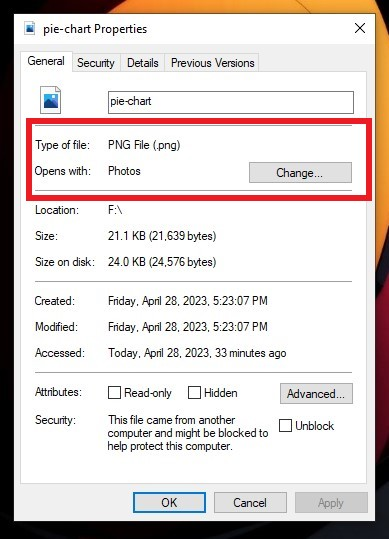
Know your pie chart file type and click the OK button.
-
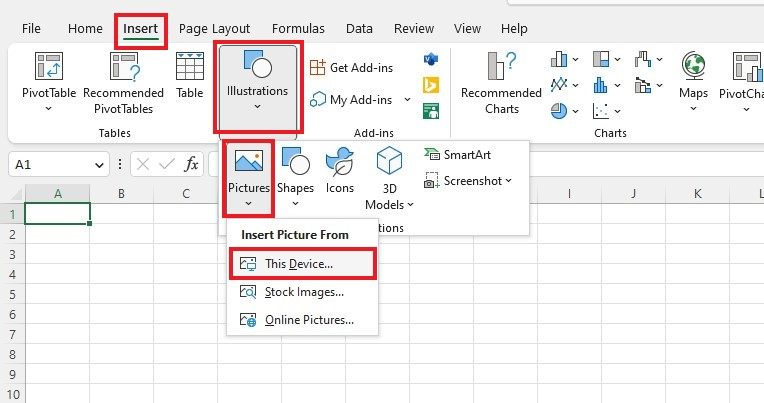
Since the pie chart is an image file type, go to the Insert tab of your Excel, click Illustration, select Pictures, and click the This Device option.
-
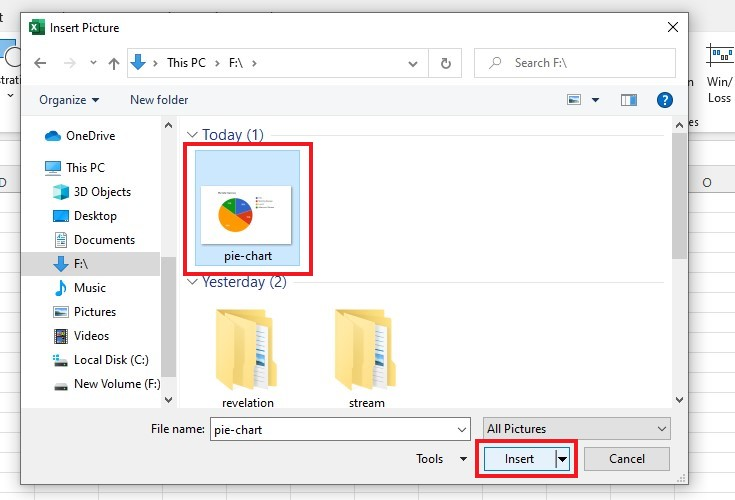
Locate your pie chart file location, then click the Insert button.
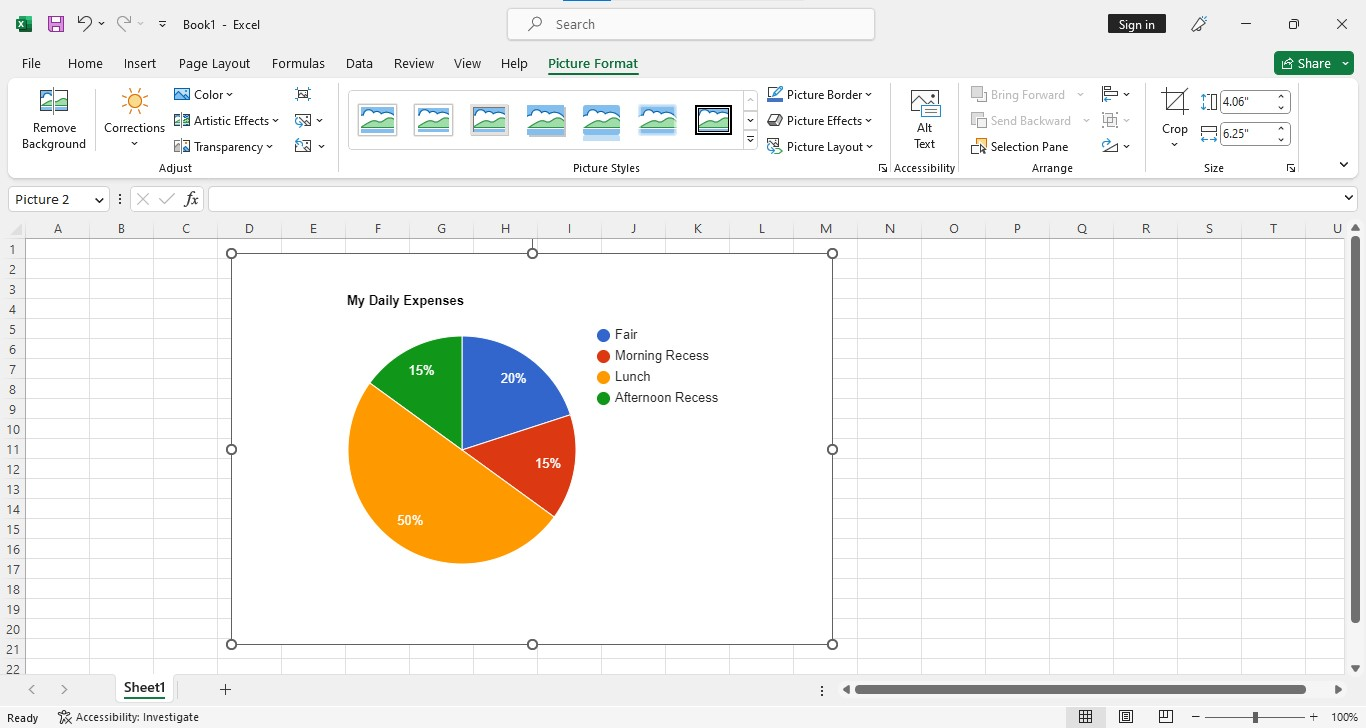
You have successfully inserted your pie chart from a Pie Chart Generator in Excel.
Read Also: Essential Google Sheets Functions and How To Use Them
The Benefits of Inserting a Pie Chart In Excel Format
Despite the initial disadvantage of inserting different formats of pie charts, there are several benefits to inserting a pie chart in an Excel format. These benefits include:
-
You can format data labels or the pie chart text in the Format Data Labels pane.
-
You can change the chart appearance in the Chart Styles group.
-
You can add Chart Elements (Chart Title, Data Labels, Legend).
-
You can format the chart area in the Format Chart Area pane.
-
You can format data series in the Format Data Series pane.
-
You can format data points.
-
You can change pie chart colors, even the pie chart box.
Note: You can't apply changes from pie charts in different file formats like PNG, JPEG, or other image file formats.
Final Thoughts on How to Insert Pie Charts in Excel
Learning how to insert a pie chart into your Excel document is an invaluable skill that can help simplify any complex data.
With so much data available to us through various sources, it is crucial to understand how to visualize and present information in a way that makes sense.
For more Excel easy-to-follow guides and the latest Excel templates, visit Simple Sheets now! and the Related Articles section of this blog post.
Don't forget to Subscribe to Simple Sheets on YouTube for more easy-to-follow Excel video tutorials!
Frequently Asked Questions on How To Insert Pie Charts In Excel
Where can I locate the Format Data Labels pane?
To locate and make changes in the Format Data Labels pane, follow the steps below:
-
Click a data label in your pie chart.
-
Right-click the data label, then click Format Data Labels pane.
You can change your data labels after opening the Format Data Labels pane.
How can I align a Pie chart in my spreadsheet?
-
Hold down the Shift key.
-
Click on the objects you want to line up.
-
Click the Shape Format tab.
-
Next, click Arrange and then Align.
-
Click Align to Page.
-
Arrange and then choose how you want them aligned.
When can I use a pie chart?
Pie charts can help you compare up to six different things. They work best when you have one data set for everything you compare.
Related Articles:
Learn How to Make a Graph in Excel With These Simple Steps
The Sunburst Chart In Excel: Everything You Need to Know
How to Overlay Graphs in Excel
Want to Make Excel Work for You? Try out 5 Amazing Excel Templates & 5 Unique Lessons
We hate SPAM. We will never sell your information, for any reason.

