
Beginners Guide: How To Insert Waterfall Charts In Excel
Mar 28, 2023
Do you want to demonstrate the cumulative effect of a sequence of positive or negative values?
Well, you must learn how to insert waterfall charts in Excel. This guide will help you to make your complex data much easier to understand with just a few clicks. This chart is simple to implement and use.
Read on as we cover the following:
-
What Is a Waterfall Chart?
-
How to Create a Waterfall Chart in Excel
-
How to Format Your Waterfall Chart
-
Final Thoughts on How to Insert Waterfall Charts in Excel
-
Frequently Asked Questions on How to Insert Waterfall Charts in Excel
Read Also: Learn How to Add a Signature in Excel?

What Is a Waterfall Chart?
Excel waterfall charts are also called bridge charts because of their connector lines that link each data point. They show the running total value or series of positive and negative values.
We usually use a waterfall chart for analytical purposes. In business settings, this chart helps evaluate changes in the company's profit, product earnings, inventory, and sales analysis over a specific period.
How to Create a Waterfall Chart in Excel
-
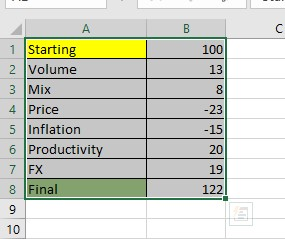
Prepare and select your date range.
Note: The data range must have starting and final values.
-
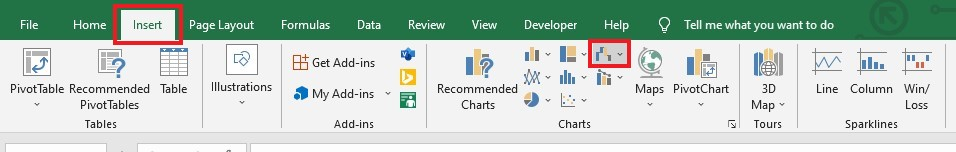
Navigate to the Insert tab options, and select the Waterfall chart icon (IWaterfall, Funnel, Stock, Surface, or Radar Chart) under the Charts group.
-
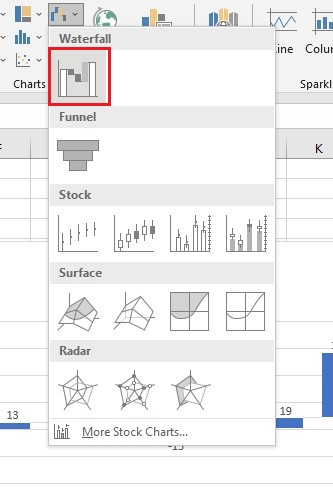
Click the Waterfall chart as your chart type in the Waterfall section.
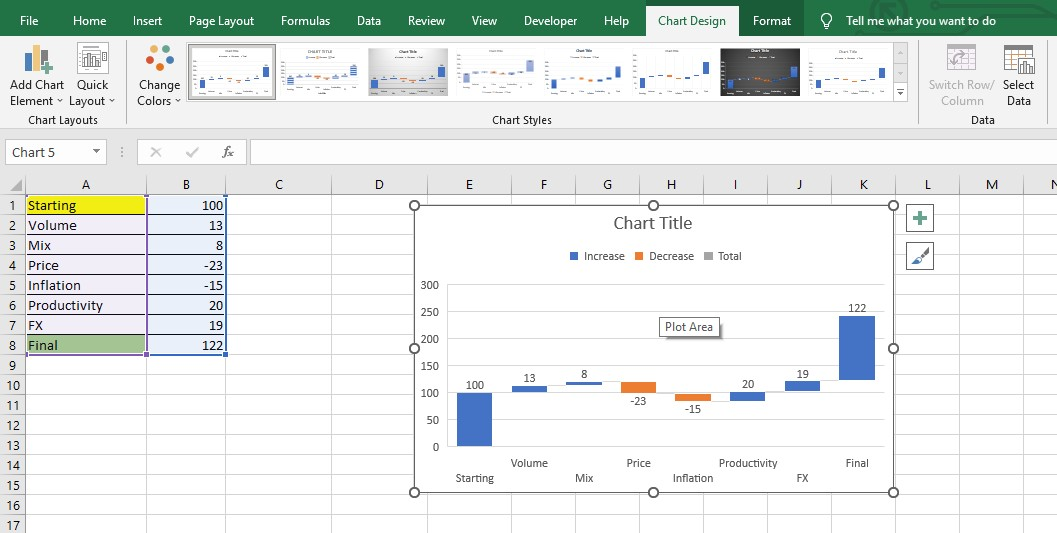
You now have your Excel Waterfall Chart presenting the data from the selected data range with starting and final values. The numbers represent the vertical axis, and the words describe the horizontal axis.
Read Also: How do I create a sunburst chart in Excel?
How to Format a Waterfall Chart
To format your waterfall chart, do the following methods.
Format Legends.
-
Click your starting value thrice and right-click, then select Set as Total.
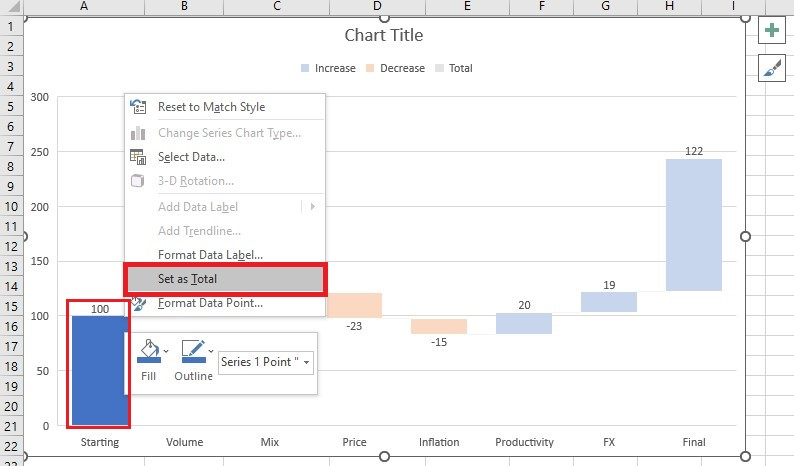
-
Do the same process from Step 1 for the final value.
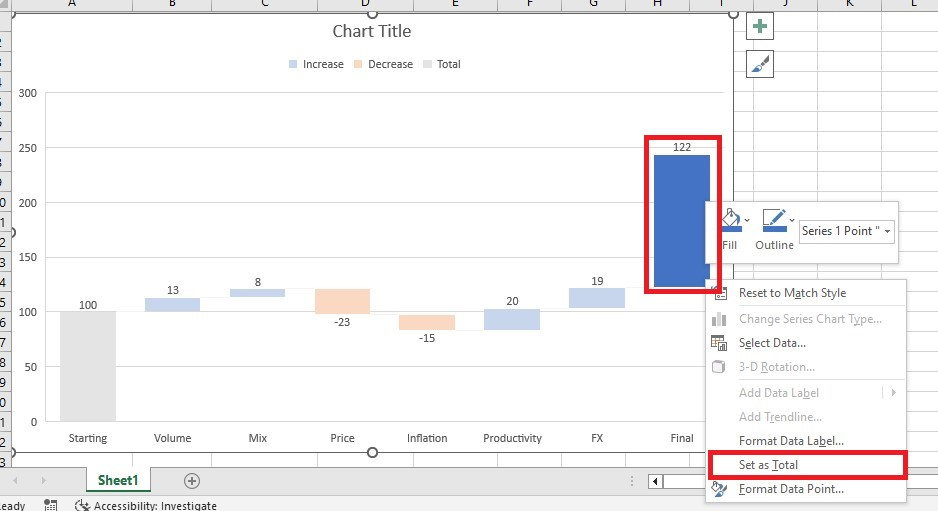
-
Click the Total box in the Chart Legend and customize colors to be color coded. The same method applies to the Increase and Decrease boxes.
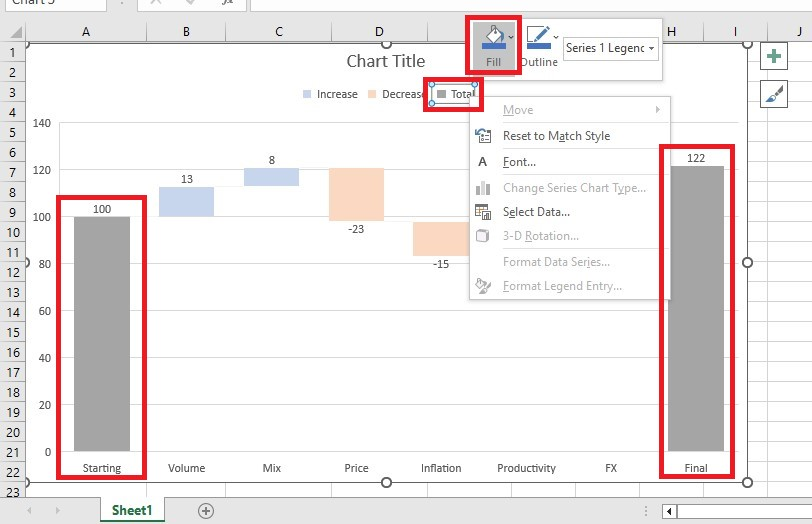
Formatting your chart legend will group the different types of data points in the Waterfall Chart, which are the negative and positive values.
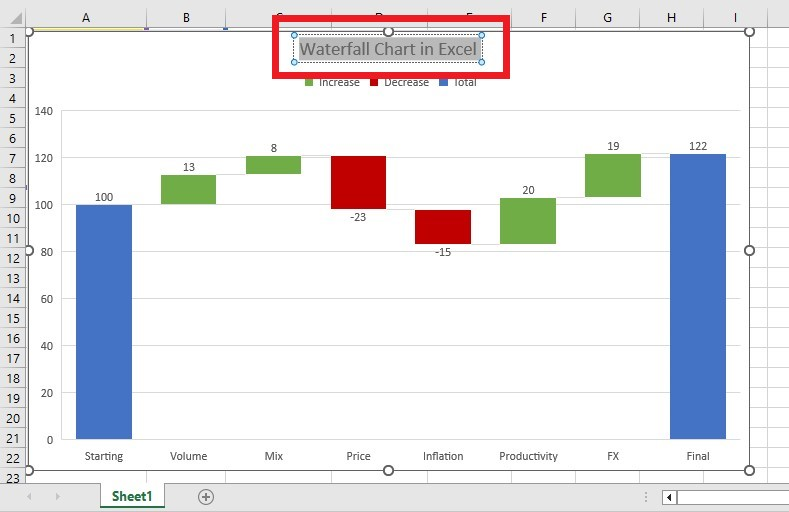
Rename the Chart Title.
To rename the chart title, click the chart title box and type the name that fits your data visualization.
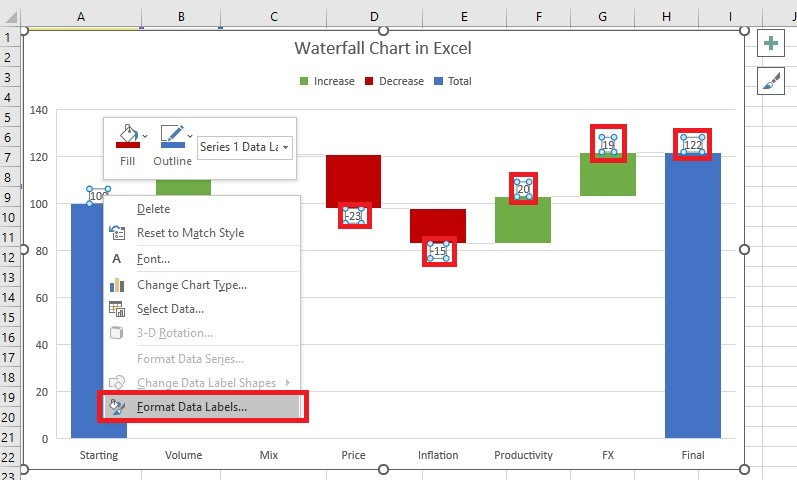
Format Data Labels.
-
Select any data labels, right-click, and choose Format Data Labels from the context menu.
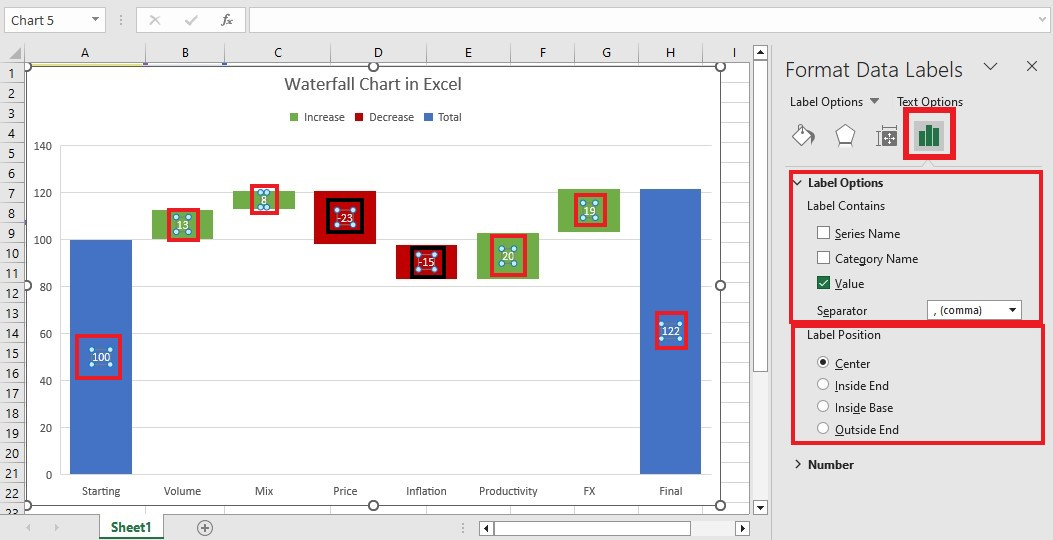
-
You can choose your Label Options and Position in the Format Data Labels pane.
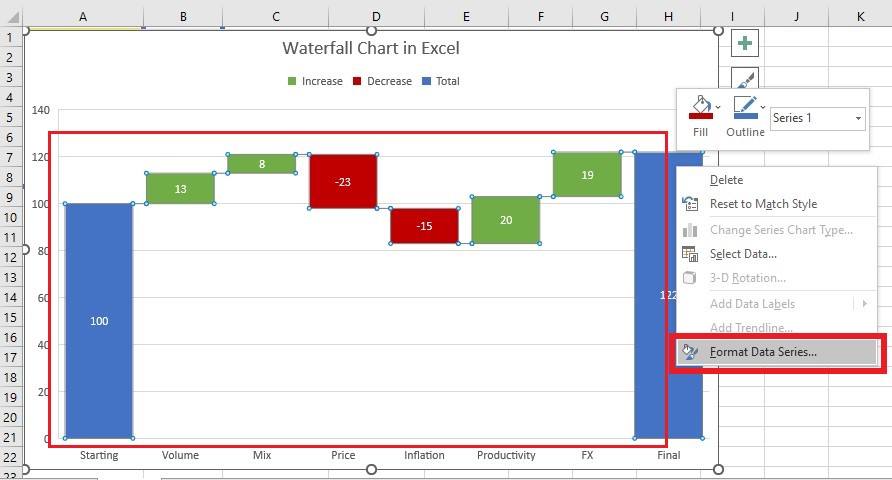
Format Data Series.
-
Select the data series, right-click, and choose Format Data Series from the context menu.
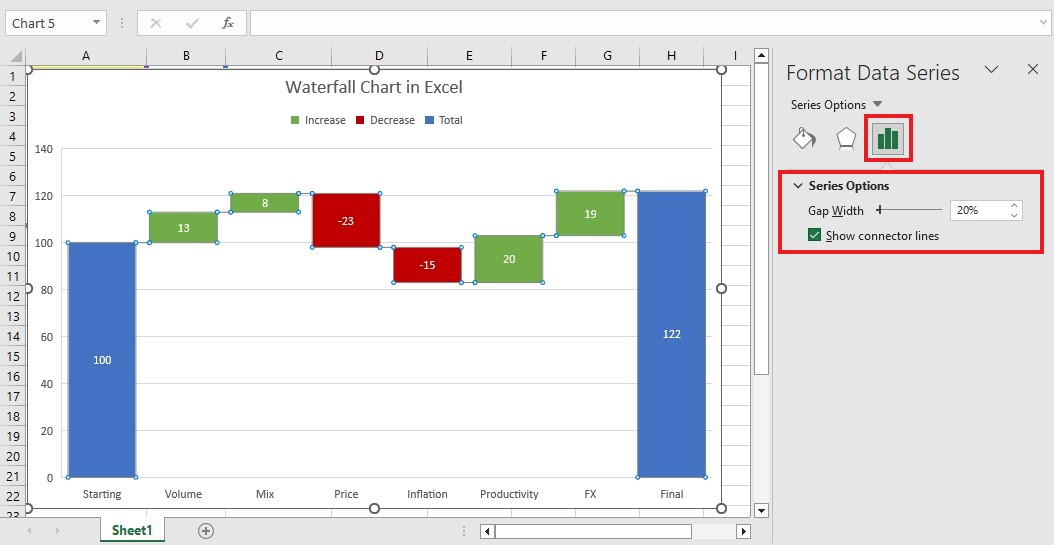
-
You can adjust the Gap Width in the Format Data Series pane and check the Show connector lines box.
Read Also: How to Compare Two Columns in Excel - Easy Guide
Final Thoughts on How to Insert Waterfall Charts in Excel
After completing the steps above, you can insert waterfall charts into Excel. Not only is this the best way to add visuals to your data, but it can also help bring more clarity and depth to your work. Waterfall charts offer reliable visual results for anyone creating effective data presentations.
For more easy-to-follow Excel guides and the latest Excel Templates, visit Simple Sheets and the Related Articles section of this blog post.
Subscribe to Simple Sheets on Youtube for the most straightforward Excel video tutorials!
Frequently Asked Questions on How To Insert Waterfall Charts In Excel:
Can I make a vertical waterfall chart?
Excel doesn't have a built-in feature for vertical waterfall charts. You can make one by using an advanced chart add-in.
How can I add axis titles for my waterfall chart?
You can add axis titles in the Chart Elements option on the right side of your chart by clicking the "+" button.
Does my waterfall chart formatting reset when I choose a chart style?
Yes. Choosing a chart style may quickly format the colors, data label positions, and other formatting properties, but it will reset your waterfall chart formatting. The best option is to select a chart style and then do the chart formatting.
Related Articles:
Beginners Guide: How To Make A Scatter Plot In Google Sheets
Beginners Guide: How To Insert Column Charts In Excel
Quick Guide: How To Insert 3D Models In Excel
Want to Make Excel Work for You? Try out 5 Amazing Excel Templates & 5 Unique Lessons
We hate SPAM. We will never sell your information, for any reason.

