
Venn Diagram: Excel Tutorial
Jul 26, 2022
Did you know you can create a Venn diagram Excel template? You can use a SmartArt graphic to create a Venn diagram layout in Excel, an idea for analyzing and comparing data.
This article will show you how to create basic Venn diagram graphs in Microsoft Excel. 
Overview of Venn Diagrams
A Venn Diagram utilizes overlapping areas to highlight differences, similarities, and relationships between groups, ideas, categories, and concepts.
The similarities between sections are shown in the overlapping portions of each circle, and differences are shown in non-overlapping portions. Creating Venn diagram designs is a great way to identify these relationships or lack thereof. 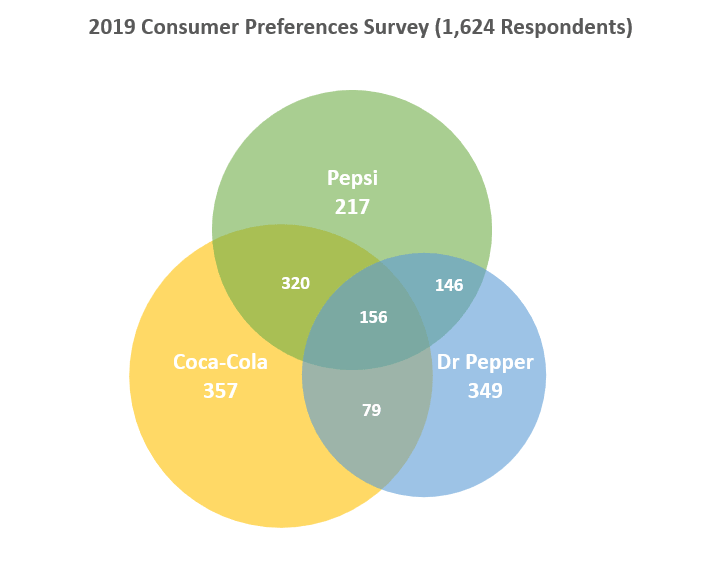
Create a Venn diagram.
Head to the Insert tab of your spreadsheet and select the SmartArt button from the Illustrations group to open the Smartart Graphic dialogue box. Select Basic Venn from the Relationship category, and hit OK. 
Add Text to a Venn diagram.
Add Text to the highest circles.
Choose a shape from the SmartArt graphic. From the Text pane, select [Text] and type your chosen Text. OR Copy Text from another location, select [Text] in the Text pane, and press paste. Add Text to the overlapping portions of the circles.
It is impossible to add Text to the overlapping areas of a Venn diagram via the Text pane. You can insert text boxes and place them in those areas to do this.
Head to the Insert tab and select the Text Box option to do this. This option will be named Draw Text Box in other Microsoft programs like Microsoft Outlook and Microsoft Word.
From there, click and drag within an overlapping area. Draw how large you want your text boxes to be. To add Text, select the box and start typing.
To amend the background color to the color of your overlapping circle, right-click on your text box and choose Format Shape.
From the Format Shape pan, below Fill, choose No Fill. To remove the lines surrounding your text box, select your text box, choose Line from the Format Shape pane, and choose No Line.
Add or Delete Circles in A Venn Diagram
Choose the existing circle to which you want to add the new circle. From the SmartArt tools section, within the Design tab, hit the Create Graphic group, and select the arrow next to Add Shape. 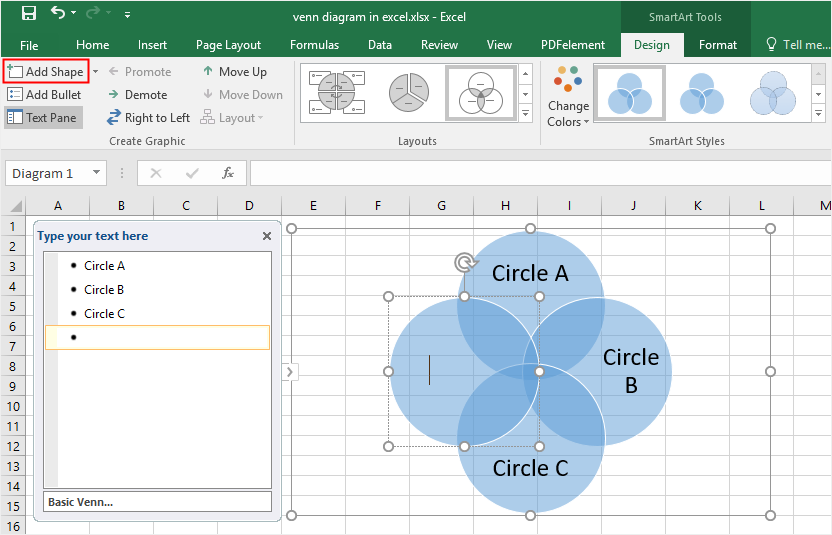 If you can't see the SmartArt Tools or Design tabs, ensure you have chosen the SmartArt graphic.
You might need to double-click the SmartArt graphic to open your Design tab. From here, to insert your circle after the chosen circle, select Add Shape After. To insert your circle before the chosen circle, select Add Shape Before.
Move a circle in your Venn diagram.
To move a circle within your Venn diagram, select the circle and then drag it to your chosen location. If you only want to move your circle briefly, you can hold CTRL and press the directional keys.
Change to a Different Venn diagram Layout.
Right-click on your Venn diagram. Select a layout option from the Layouts Group within the SmartArt tools section. If you point towards a layout option, you will see a preview of how it would look. Select the proper layout for your needs.
For overlapping relationships within a sequence, choose Linear Venn; for overlapping relationships that highlight graduation or growth, choose Stacked Venn. To highlight overlapping relationships about the central idea, choose Radial Venn. 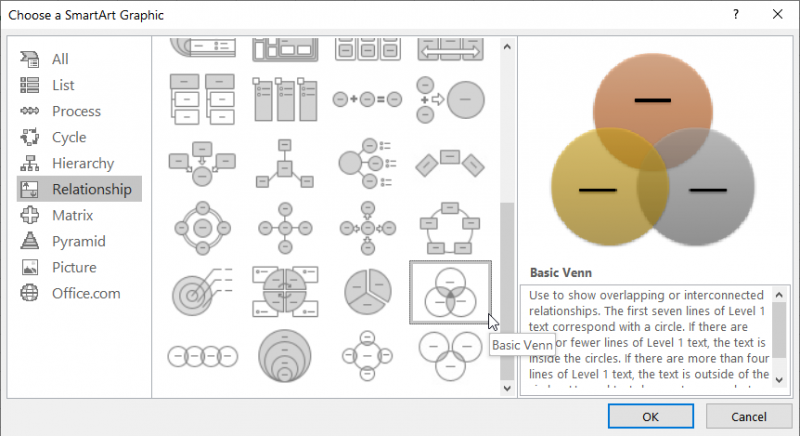
Change the colors of your Venn diagram.
To add a high-quality look and feel to your SmartArt graphic, you can amend the colors of the Venn diagram.
Not only that, but you can include different effects. To do this, select the SmartArt graphic you want to change the color of. From the SmartArt tools section, within the Design tab, select Change Colors.
Frequently Asked Questions:
Can you make a Venn diagram in Excel?
Head to the Insert tab of your spreadsheet and select the SmartArt button from the Illustrations group to open the Smartart Graphic dialog box. Select Basic Venn from the Relationship category, and hit OK. 
Related Articles:
How to Insert Line of Best Fit in Google Spreadsheets
Microsoft Excel is Waiting for Another Application to Complete an OLE Action - What Does This Mean?
Want to Make Excel Work for You? Try out 5 Amazing Excel Templates & 5 Unique Lessons
We hate SPAM. We will never sell your information, for any reason.

