
Excel Pivot Table Training: Everything You Need to Know
Jul 26, 2022
A pivot table is easily one of the best functions within Microsoft Excel for gathering data and values into categories and clearly visually understanding details.
However, a pivot table can seem intimidating to anyone, not an Excel expert, and many users worldwide find that hard to use and format correctly. But don't worry.
Learning to create a pivot table in Excel is much easier than you think with these relevant tips and tricks. This article will explain the value of a pivot table, how to access them in Excel, and how to become an expert in using them. 
What is a Pivot Table?
In short, a pivot table summarizes your data clearly and visually within a chart. This table allows you to explore and report on trends based on the information displayed.
Pivot tables are convenient when your spreadsheet contains long rows or columns of data, and you need to track the sum of the values quickly and easily.
What are Pivot Tables Used for?
If you are still unsure about what a pivot table does, don't worry! Here are a few scenarios where a pivot table could be a solution.
Comparing sales totals of different products
Let's pretend for a second that you have a worksheet full of monthly sales data for multiple products. Suppose you want to identify which of those multiple products performs best.
You could do this manually by adding all the corresponding sales data and counting how many times each product appears, but that takes so much time! Especially if your sales worksheet is full of thousands of rows.
Instead, correctly implementing a pivot table will automatically aggregate all your sales figures and calculate their respective sums.
Displaying product sales as percentages of all sales.
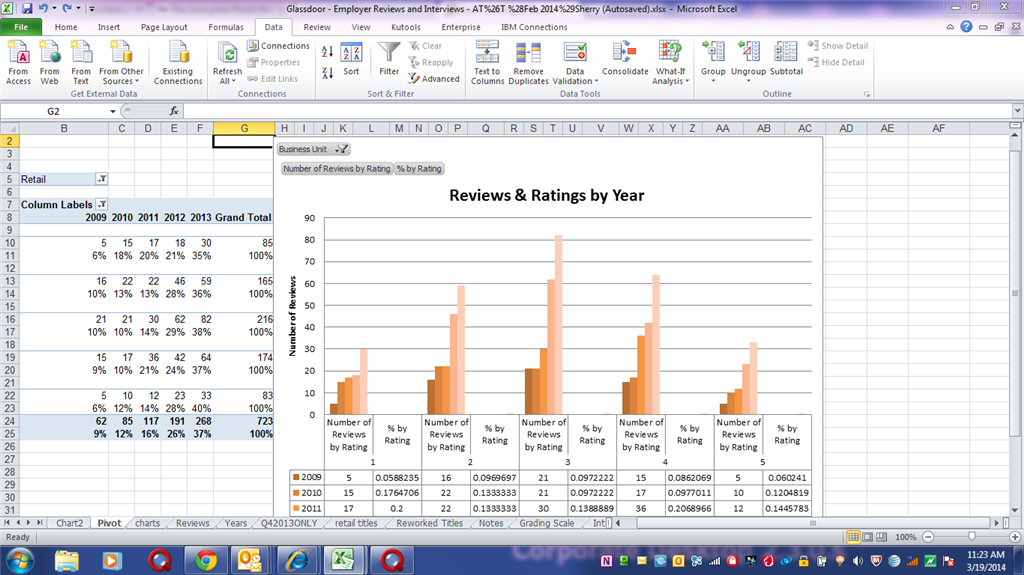
For example, imagine you have submitted quarterly sales numbers for multiple products in one Excel worksheet and have input this date into your pivot table.
This pivot table would offer you three totals automatically and the bottom of every column, which is the Total of each product's quarterly sales.
However, what if you wanted to see the percentage breakdown of each product sale compared to overall company sales?
A pivot table allows you to configure every column to offer the percentage of every column rather than simply the column total. To highlight product sales as percentages within your pivot table, right-click the cell containing your sales Total and choose Show Values As - % of Grand Total.
How to Create a Pivot Table
- Input the data into your range of columns and rows. Remember to adjust your column widths if it is hard to see.
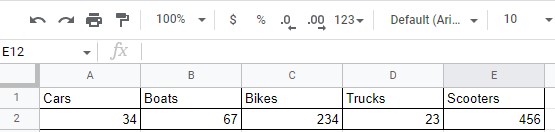
- Sort the data by a chosen attribute. This filter will help you down the line.
- Next, highlight the cells you want to insert your pivot table onto.
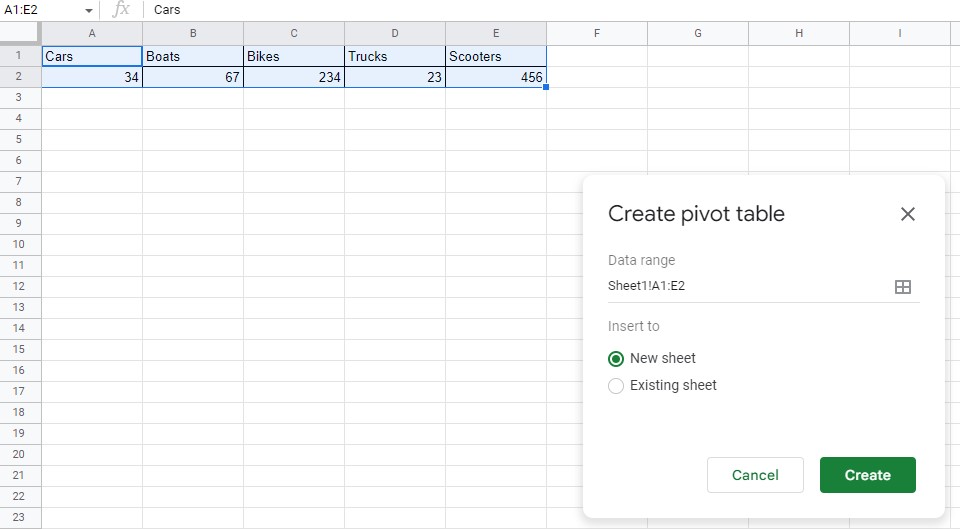
- Drag and drop a chosen field within Row Labels.
- Drag and drop another chosen field but within the Values area.
- Play with these options while creating your table until you are happy with the results.
Excel Pivot Table Training: Summary and Key Takeaways
Now you have learned the basics of creating a pivot table in Microsoft Excel, and you can start working out what you need where in your pivot table to see the solutions you are after! Play around with your calculated fields and other aspects of your Microsoft Excel document to further improve your skills.
Frequently Asked Questions About Microsoft Excel Tables
Are Excel pivot tables hard to learn?
Learning to create pivot tables can be tricky but will vastly improve your data analysis skills and help you interpret external data easily and quickly. Learning how to analyze a data set with this online course on pivot tables is one of the essential tools you can learn in Microsoft Excel.
What is the best way to learn pivot tables in Excel?
While some video tutorials and online courses promise to help you learn how to implement pivot tables in an existing or new worksheet, they often leave you confused and with a spreadsheet full of empty cells.
Instead, use this guide to help you, and you will quickly learn how to manage Pivot Table data and improve your Excel skills.
What is the use of PivotTable in MS Excel?
A pivot table is a fantastic way to summarize all the data you need in Excel, either with recommended pivot tables or custom-made layouts. 
Related Articles:
How to Insert Line of Best Fit in Google Spreadsheets
Microsoft Excel is Waiting for Another Application to Complete an OLE Action - What Does This Mean?
Want to Make Excel Work for You? Try out 5 Amazing Excel Templates & 5 Unique Lessons
We hate SPAM. We will never sell your information, for any reason.

