
How to Add a Trend-line in Excel Online
Feb 01, 2025
Summary: Adding Trendlines in Excel
This guide explains how to add and customize trendlines in Excel Online to analyze data patterns. It covers inserting a line chart, selecting from various trendline types (Linear, Exponential, Moving Average, etc.), and formatting them for clarity.
Additionally, it demonstrates how to use trendlines for forecasting future data, adding multiple trendlines to a single chart, and removing them when necessary.
Get our free Excel formulas cheat sheet
Plus new tutorials and template drops. Enter your email and we'll send it over.
Table of Contents
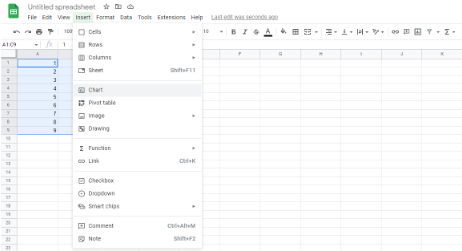
Here's a quick step-by-step guide for how to add a trendline in Excel Online via a Line Chart.
-
Highlight the data table, head to the insert tab, and then Recommended Charts.
-
Choose All Charts, Line, then hit OK.
-
Right-click on the line within your line chart and choose to Add Trendline.
-
Choose Linear, then close the Format Trendline Pane.
You can follow the same process for adding a trendline into a bar chart.
Suggested read: What is Macro Button in Excel, and How to Create One?
Different types of Trendlines

There is more than one type of Trendline in Excel Online for you to take advantage of.
-
Logarithmic Trendline: Perfect for highlighting data that rises or falls quickly before leveling out.
-
Exponential Trendline: This Trendline highlights the increase or decrease in a data value, often through a curved trend line.
-
Linear Trendline: This straight-line Trendline highlights the increase or decrease in data value.
-
Moving Average Trendline: This Trendline is used to smoothen extreme fluctuations in data, to help establish a more transparent data trend.
-
Polynomial Trendline: Perfect for highlighting fluctuating data that doesn't follow a simple rise and fall.
Suggested read: Pivot Table Training for Excel
Format the Trendline
Once you are comfortable adding trendlines in Excel Online, we can focus on formatting your trendlines. Formatting includes changing your trend line's width, color, transparency, and other aspects.
To format your trend line:
-
Right-click Trendline.
-
Choose the Format Trendline option, and the Format Trendline window will open.
-
From that window, select fill & line.
-
Choose your color, amend the width, and alter the transparency.
Use Trendlines to Forecast Future Data
One of the best benefits of using a trendline in Excel Online is that you can project data trends into the future.
-
Double-click on your trend line and open the Format trendline pane.
-
Choose the Trendline Options tab.
-
Select how many periods you want to create from the forecast and type that number in the forward box.

Add multiple trendlines to the same chart.
We have only focused on adding one Trendline in Excel Online. Now, let's focus on adding multiple trend lines.
For this example, let's say you want to add a moving average and a linear trendline to your spreadsheet. Add your moving average Trendline using the steps outlined above, and then follow these steps to add your linear Trendline.
-
Select the Char Elements option from the right-hand corner of your chart
-
Select the arrow that sits next to Trendline.
-
Choose Linear Trendline from the list.
-
Select where you want to see your linear Trendline.
You should see more than one Trendline in Excel Online if done correctly.
How to remove Trendline in Excel
If you have a trendline in Excel Online that you would like to remove, perhaps because it is not highlighting a data point as you had hoped, it is quick and easy.
-
Select Excel Chart.
-
Select the Chart Elements option from the right-hand corner of your chart.
-
Uncheck the trend line box. If you do this correctly, you will see the straight or curved line disappear.
Frequently Asked Questions
Why is the "Add Trendline" option grayed out?
This usually happens if you are using a chart type that does not support trendlines. Stacked charts, 3-D charts, Radar charts, and Pie charts do not allow trendlines. To fix this, switch your chart type to a standard 2-D Bar, Column, Line, or Scatter chart.
Can I display the equation of the line on the chart?
Yes. After adding the trendline, open the Format Trendline pane (right-click the trendline > Format Trendline). At the bottom of the options, check the box that says "Display Equation on chart". You can also check "Display R-squared value" to see how closely the trendline matches your data.
Which trendline type should I use?
It depends on your data:
- Linear: Best for simple data that increases or decreases at a steady rate.
- Exponential: Best for data that rises or falls at increasingly higher rates.
- Moving Average: Best for data with lots of ups and downs (fluctuations) to show the general pattern clearly.
Want to Make Excel Work for You? Try out 5 Amazing Excel Templates & 5 Unique Lessons
We hate SPAM. We will never sell your information, for any reason.

