
Beginners Guide: How to Do Confidence Intervals in Google Sheets
Mar 09, 2023
Would you like to learn how to do Confidence Intervals in Google Sheets?
If you need help understanding whether your estimates are correct, Google Sheets has a function that can help.
Confidence Intervals are a way to check if the data from experiments or surveys are correct. It can help you understand the results better.
Read on as we cover the following:
-
Functions and syntaxes to get confidence intervals in Google Sheets.
-
Calculate confidence intervals lower and upper bounds.
-
Calculate a confidence interval.
-
Final thoughts on how to do confidence intervals in Google Sheets

Functions and Syntaxes to Get Confidence Intervals in Google Sheets.
When calculating confidence interval manually, you might need these Function Syntaxes:
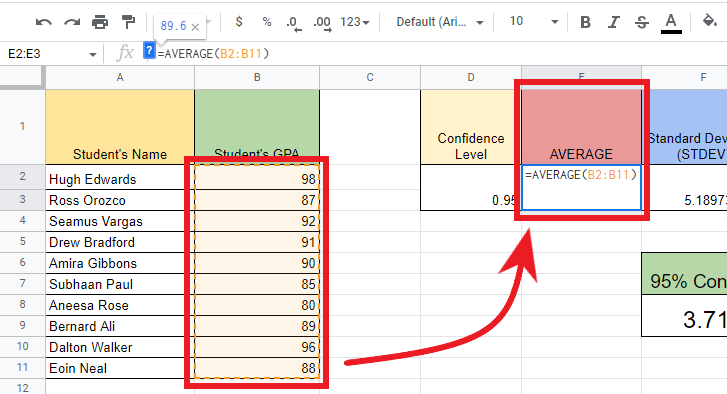
Average Function Syntax.
Add all the numbers together. Then divide that number by how many numbers there are.
AVERAGE(value1, [value2, …])
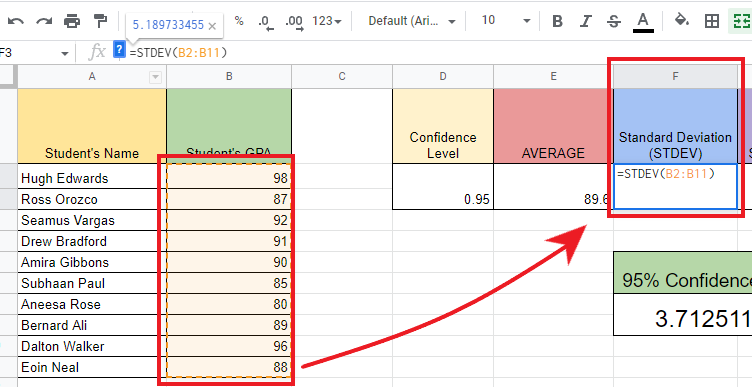
Standard Deviation Function Syntax.
Standard deviation is a way to measure how different the numbers in a group are from each other. 95% of the numbers are usually close to the average number.
That means 95 out of 100 numbers will be within two steps from the average number.
STDEV(value1, [value2, …])
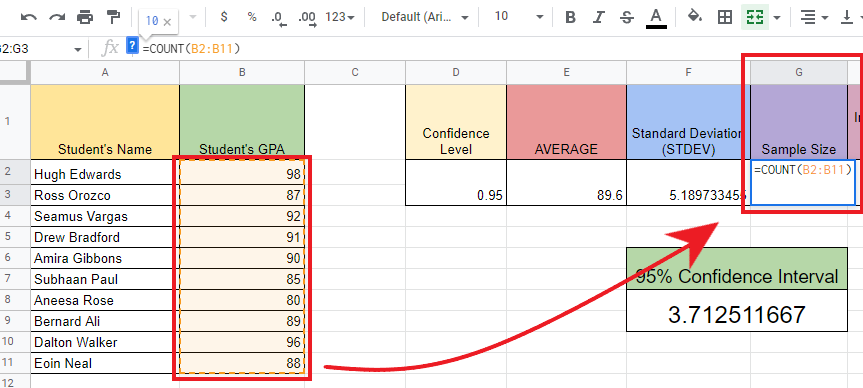
Count Function Syntax for Sample Size.
The COUNT function is like a calculator. It counts how many cells have numbers in them. It also counts the numbers that you put in the list.
COUNT(value1, [value2, …])
95% Confidence Interval Lower and Upper Bound using Inverse Function.
-
Lower Bound- A number smaller than or equal to all the numbers in a group.
="Average"-T.INV("Confidence Level","Sample Size"-1)*("Standard Deviation"/SQRT("Sample Size"))
-
Upper Bound- A number bigger than or equal to all the numbers in a group.
="Average"+T.INV("Confidence Level","Sample Size"-1)*("Standard Deviation"/SQRT("Sample Size"))
95% Confidence Interval Lower and Upper Bound using "Normal Distribution Inverse Function."
-
Lower Bound using "Normal Distribution Inverse Function." A number smaller than or equal to all the numbers in a group.
="Average"-NORM.S.INV("Confidence Level")*("Standard Deviation"/SQRT("Sample Size"))
-
Upper Bound using "Normal Distribution Inverse Function." A number bigger than or equal to all the numbers in a group.
="Average"+NORM.S.INV("Confidence Level")*("Standard Deviation"/SQRT("Sample Size"))
Read Also: How to get Remainder in Excel using MOD Formula
Calculate Confidence Intervals Lower and Upper Bounds.
Let's assume you want to calculate the Confidence Interval of your student's average GPA. To solve your problem, you need to follow the steps below:
-
Put the Average Formula under the Average cell and select cells b2:b11 as your value.
-
Put the sample Standard Deviation Formula under the Standard Deviation cell and select cells b2:b11 as your value.
-
Put the Count Formula under the Sample Size cell and select cells b2:b11 as your value.
-
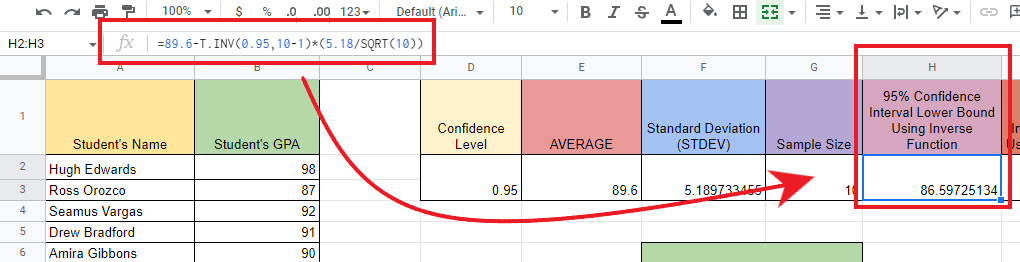
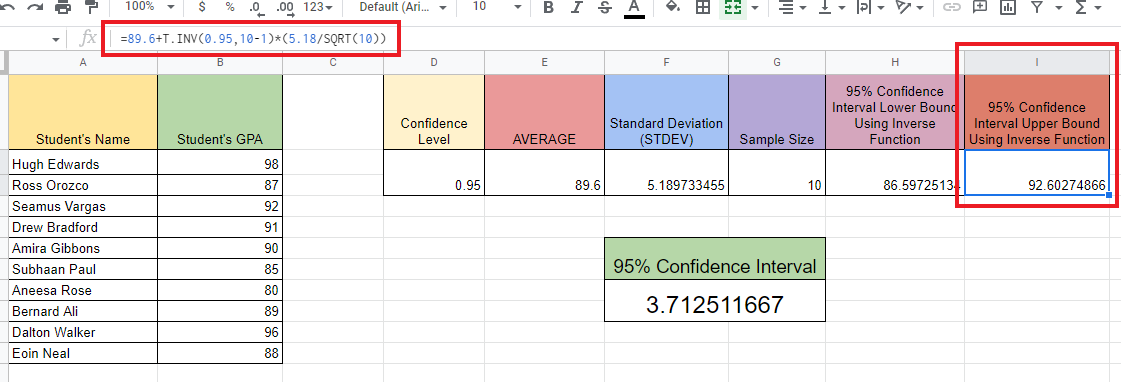
To get the Lowest number of a range, use this formula: "=89.6+T.INV(0.95,10-1)*(5.18/SQRT(10))". This will give you the 95% Confidence Interval Lower Bound.
"89.6"- Average
"0.95"- Desired Confidence Level
"10-1"- Sample Size Probability
"5.18"- Standard Deviation
"10"- Sample Size
-
To get the highest number of a range, use this formula: "=89.6+T.INV(0.95,10-1)*(5.18/SQRT(10))". This will give you the 95% Confidence Interval Upper Bound.
"89.6"- Average
"0.95"- Desired Confidence Level
"10-1"- Sample Size Probability
"5.18"- Standard Deviation
"10"- Sample Size
Read Also: How to Use Google Sheets in Dark Mode
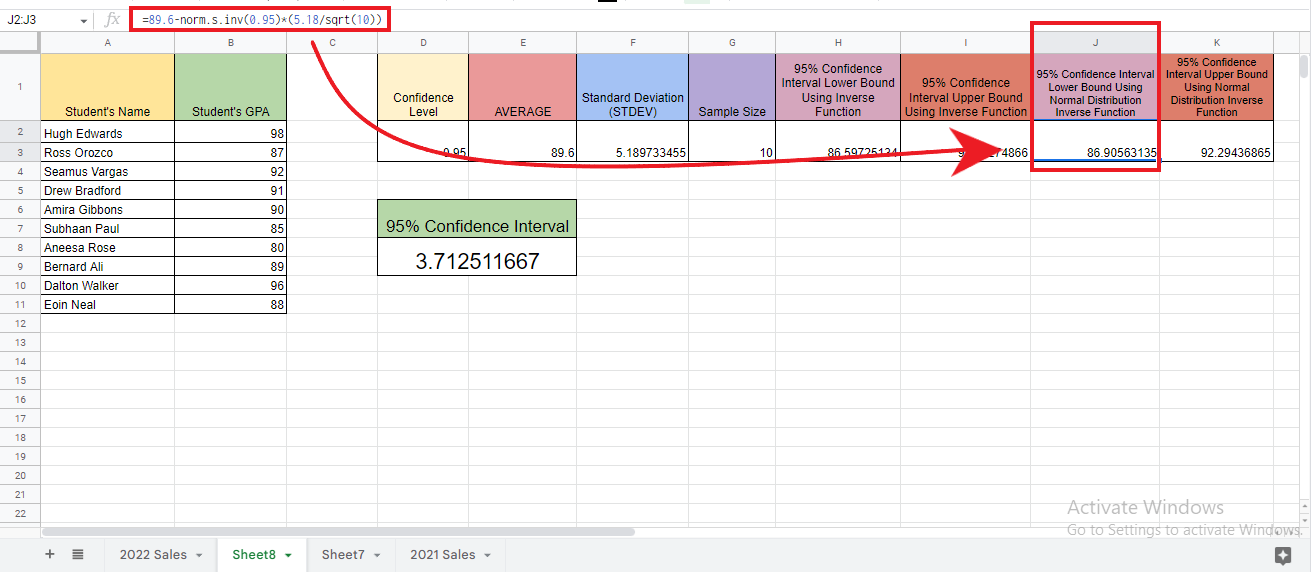
How to get the Confidence Interval Lower and Upper Bound using Normal Distribution Inverse Function.
To get the confidence interval lower and upper Bound using the normal distribution inverse function, put the formula in each designated cell in the Formula tab:
-
Lower Bound using "Normal Distribution Inverse Function." A number smaller than or equal to all the numbers in a group.
="Average"-NORM.S.INV("Confidence Level")*("Standard Deviation"/SQRT("Sample Size"))
-
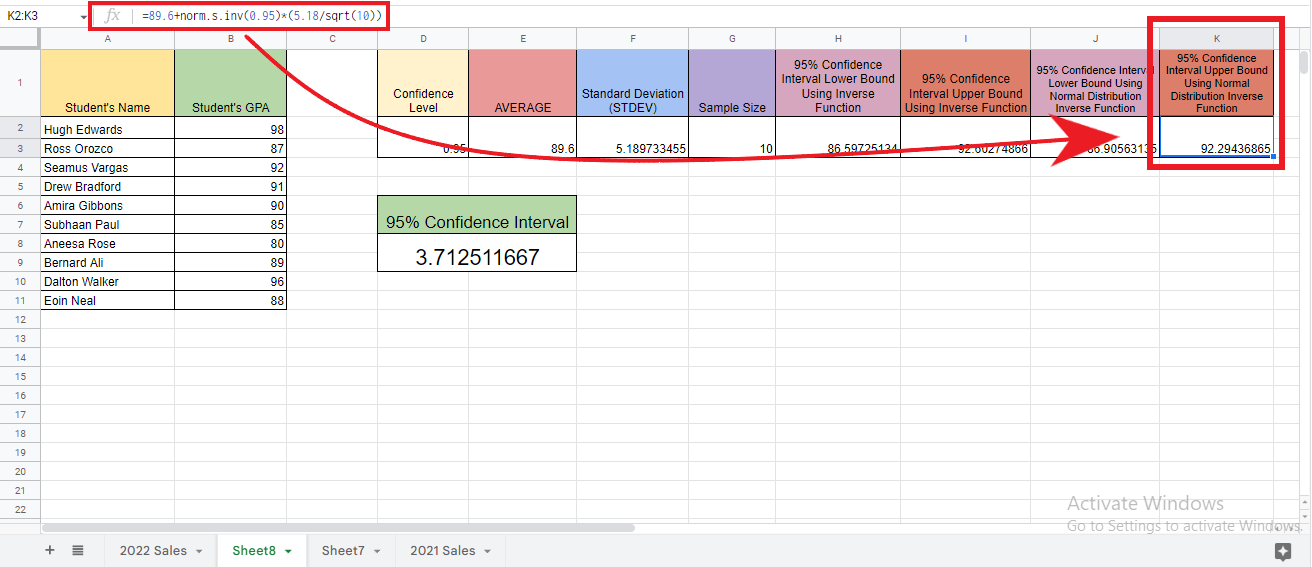
Upper Bound using "Normal Distribution Inverse Function." A number is more significant than or equal to all the numbers in a group.
="Average"+NORM.S.INV("Confidence Level")*("Standard Deviation"/SQRT("Sample Size"))
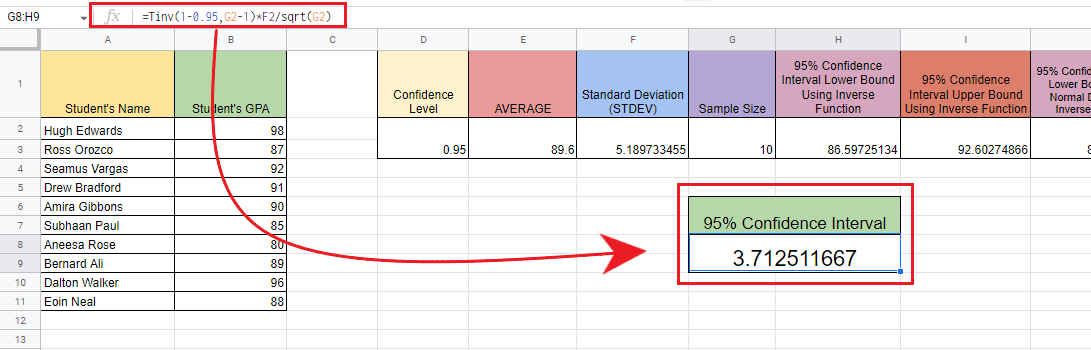
Calculate the Confidence Interval in Google Sheets.
=Tinv(1-"Confidence Level","Sample Size"-1)*("Standard Deviation"/sqrt("Sample Size"))
Final Thoughts on How to do Confidence Intervals in Google Sheets.
These steps to get confidence intervals in Google Sheets will help you get reliable and accurate data.
Visit our home page for easy guides. Check the links in related articles to learn more about Excel/Google Sheets Templates!
Frequently Asked Questions on How to Do Confidence Intervals in Google Sheets:
When can I use the actual population?
You can use the Actual Population to determine how close your sample is to the answer. This is also called finding the upper and lower bounds around the sample mean.
When can I use T-Distribution when using Confidence Intervals?
If you're working with a small sample like (n<20) or less than 20, you can use the T-distribution.
Related Articles:
How to Calculate Confidence Interval in Excel: Easy-to-Follow Steps
How to Sum a Column in Google Sheets:4 Easy Methods
The SUMIFS Google Sheets Function: Everything You Need To Know
Want to Make Excel Work for You? Try out 5 Amazing Excel Templates & 5 Unique Lessons
We hate SPAM. We will never sell your information, for any reason.

