The Easiest Way to Connect a Slicer to Multiple Pivot Tables in Excel
Feb 24, 2023
Connecting a slicer to multiple pivot tables is the fastest way to filter several reports at once from a single control. This guide shows you how to connect a slicer to multiple pivot tables in Excel using Report Connections, what to do when a pivot table will not appear in the list, and how to handle pivot tables built on a different data source.
Quick answer: To connect one slicer to multiple pivot tables in Excel, right-click the slicer and choose Report Connections, then tick the box for every pivot table you want it to control and click OK. Report Connections only lists pivot tables built on the same source data, so build them from one shared table.
Last updated: August 24, 2026
What this guide covers
- What a slicer is, and what Report Connections does
- How to insert a slicer in a pivot table
- What must you do first before adding another slicer to a pivot table
- How to connect a slicer to multiple pivot tables, step by step
- Why your pivot table is missing or greyed out in Report Connections
- How to use one slicer for multiple pivot tables from a different data source
- How to link two pivot tables in Excel
- Can you connect two slicers to each other in Excel
- How to connect a pivot table to an existing slicer
- Where Report Connections lives in each Excel version
- Slicer troubleshooting table
- Frequently asked questions
Get our free Excel formulas cheat sheet
Plus new tutorials and template drops. Enter your email and we'll send it over.
What is a slicer, and what does Report Connections do?
A slicer is a visual filter button panel that sits on the worksheet and filters a pivot table when you click a value. Instead of opening a drop-down inside the pivot table, you click "East" on a region slicer and the pivot table redraws.
By default a slicer filters only the one pivot table it was inserted from. Report Connections is the dialog that tells a single slicer which other pivot tables it is allowed to control. That is the whole mechanism behind a pivot table with slicers that drive an entire dashboard.
Two related controls are worth knowing:
- Timeline. A date-specific version of a slicer. It uses the same Report Connections dialog.
- Filter Connections. The same relationship viewed from the pivot table side. See connecting a pivot table to an existing slicer below.
How do you insert a slicer in a pivot table?
Before you can connect anything, you need at least one slicer. To add a slicer to a pivot table:
- Click any cell inside the pivot table. The contextual PivotTable tabs only appear on the ribbon while a pivot table cell is selected.
- Go to PivotTable Analyze (called Options in Excel 2010) and click Insert Slicer.
- In the Insert Slicers dialog, tick the field you want to filter by, for example Month or Region, and click OK.
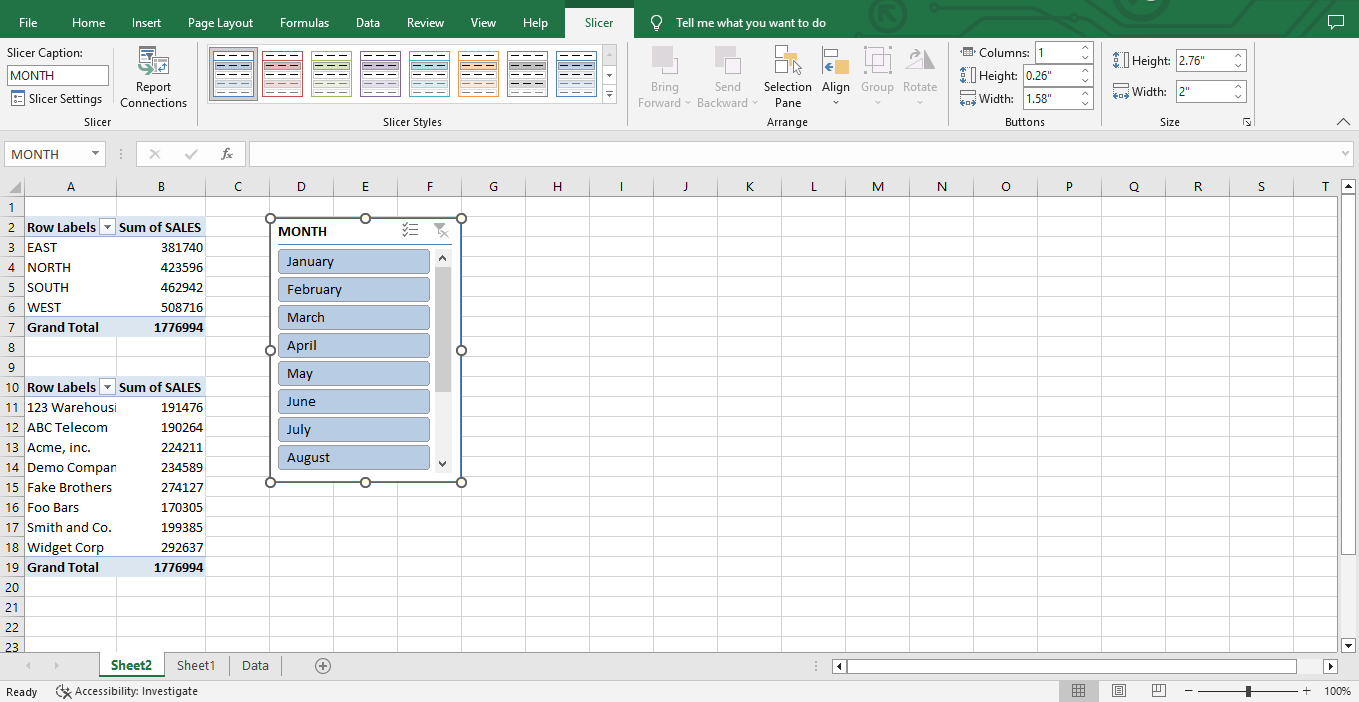
- Drag the slicer where you want it and resize it. Use the Columns setting on the Slicer tab to lay the buttons out in a row.
Rule to remember: Insert Slicer is greyed out unless the active cell is inside a pivot table, a formatted Excel table, or a PivotChart.
What must you do first before adding another slicer to a pivot table?
You must click inside the pivot table first. Insert Slicer lives on the contextual PivotTable Analyze tab, and that tab is hidden until a pivot table cell is the active cell. If you click on a blank worksheet cell or on the existing slicer, the command is unavailable.
There is a second prerequisite that trips people up when the goal is a shared slicer rather than a second independent one. If you want the new slicer to filter more than one pivot table, those pivot tables must already share the same source data. That is covered next.
How to connect a slicer to multiple pivot tables in Excel
This is the full walkthrough: build two pivot tables from one table, insert a slicer in each, then use Report Connections to link the slicer to multiple pivot tables.
-
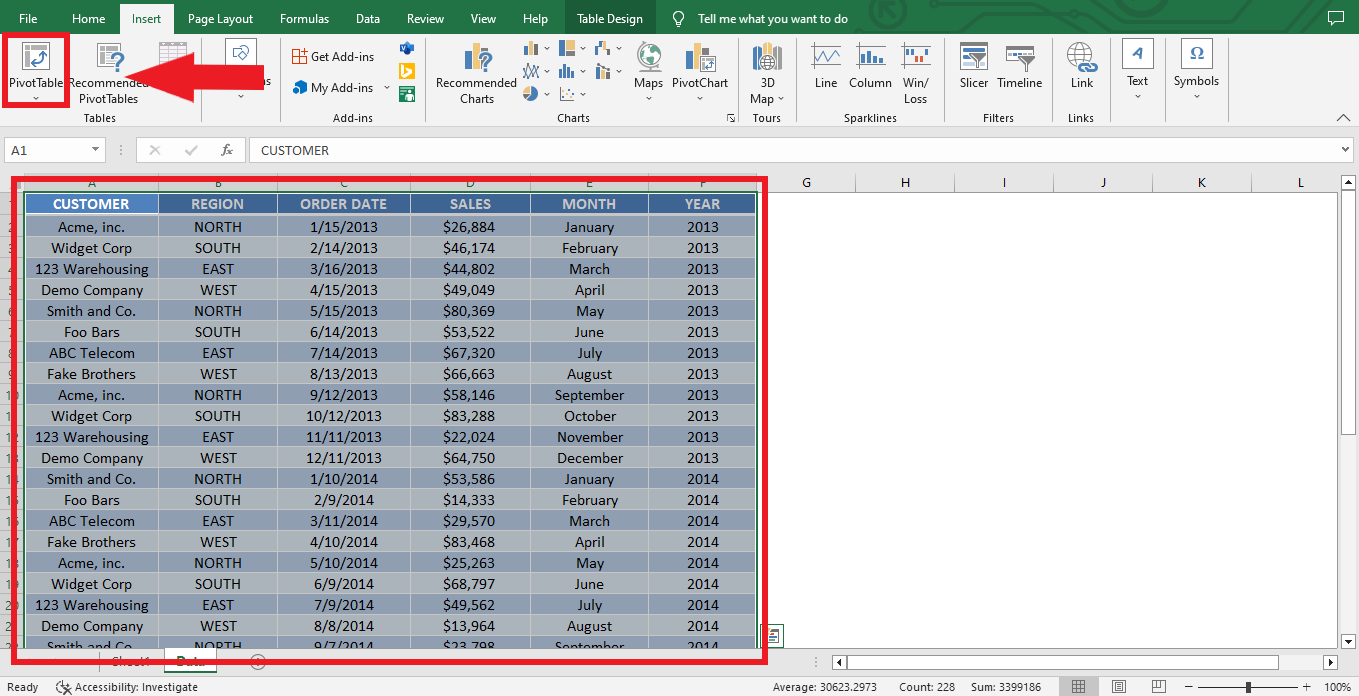
To create multiple pivot tables, press CTRL + A to select all the data in the table, then on the Insert tab click PivotTable.
-
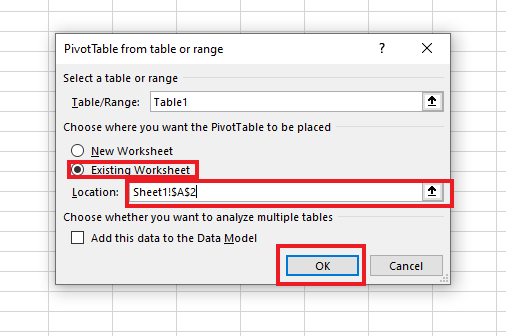
A PivotTable dialog box will pop up. Select the worksheet where you want to place your pivot table and click OK.
-
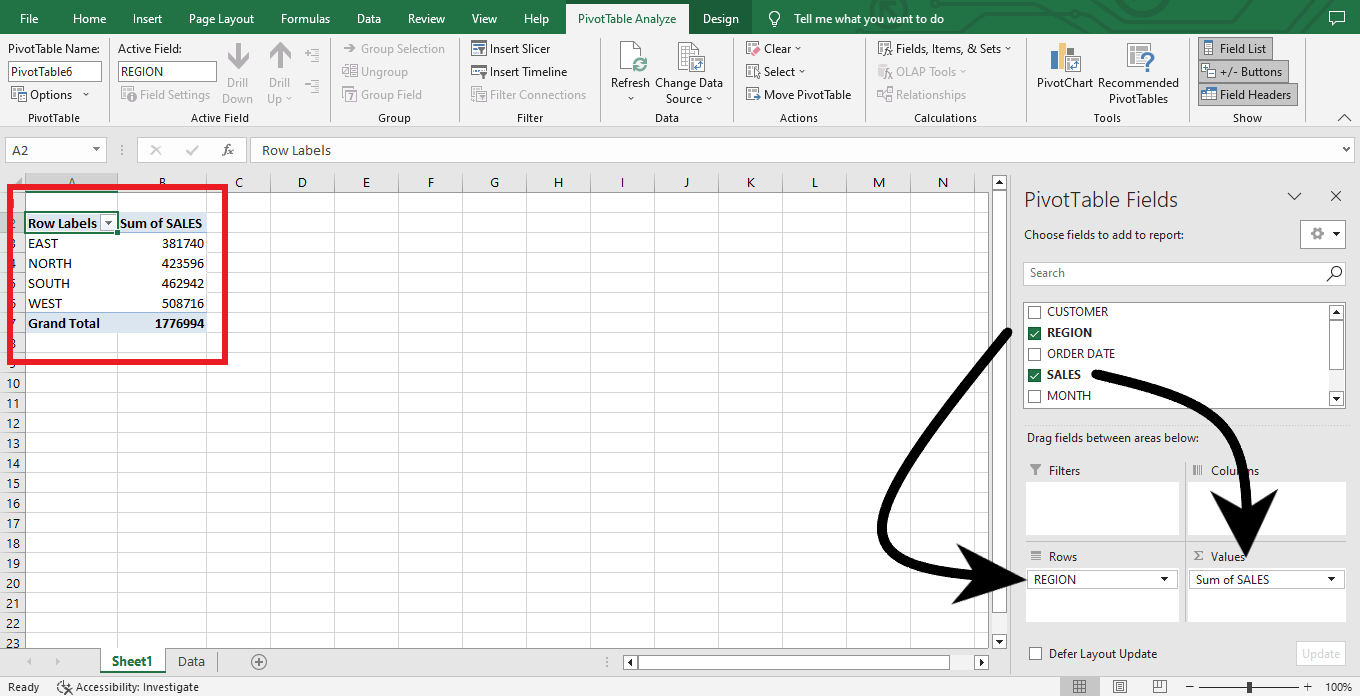
For your first pivot table, in the PivotTable Fields pane, drag "REGION" to the Rows area and "SUM" to the Values area.
-
For your second pivot table, drag "CUSTOMER" to the Rows area and "SUM" to the Values area. You should now have two pivot tables built from the same source table.
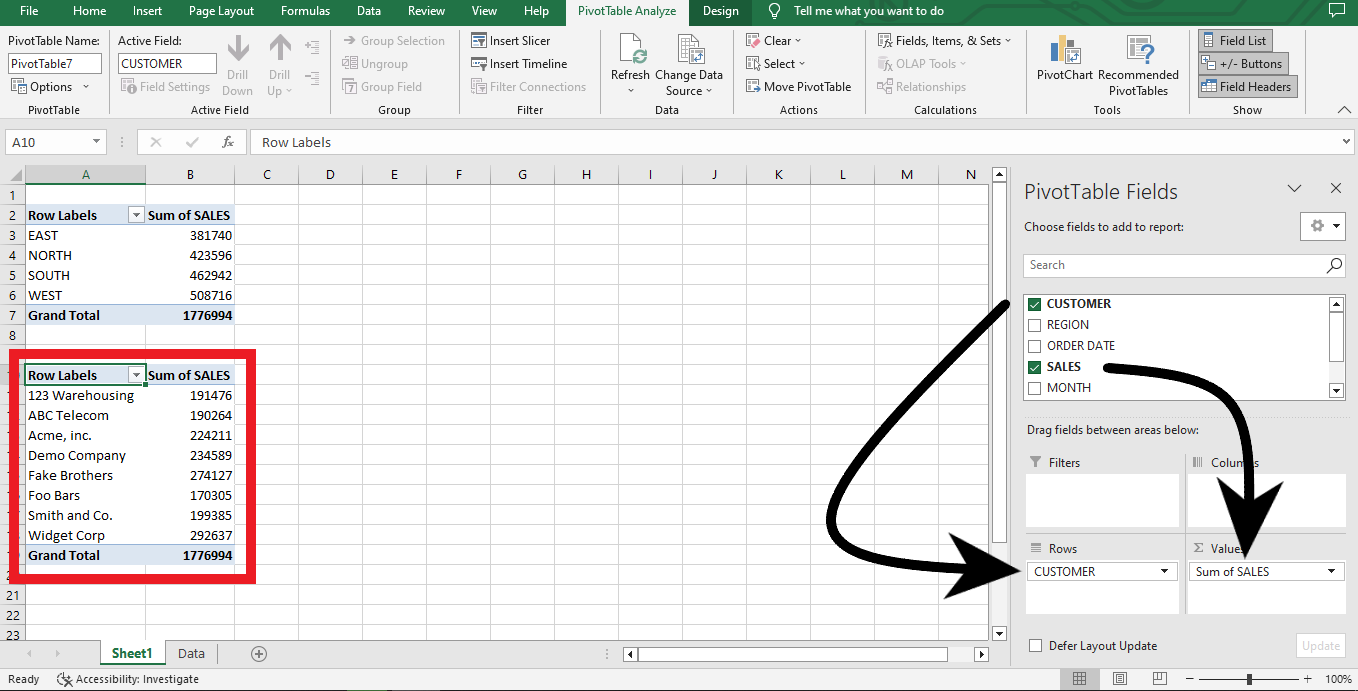
-
Check both pivot tables are showing the data sets you expect before you add any slicers.
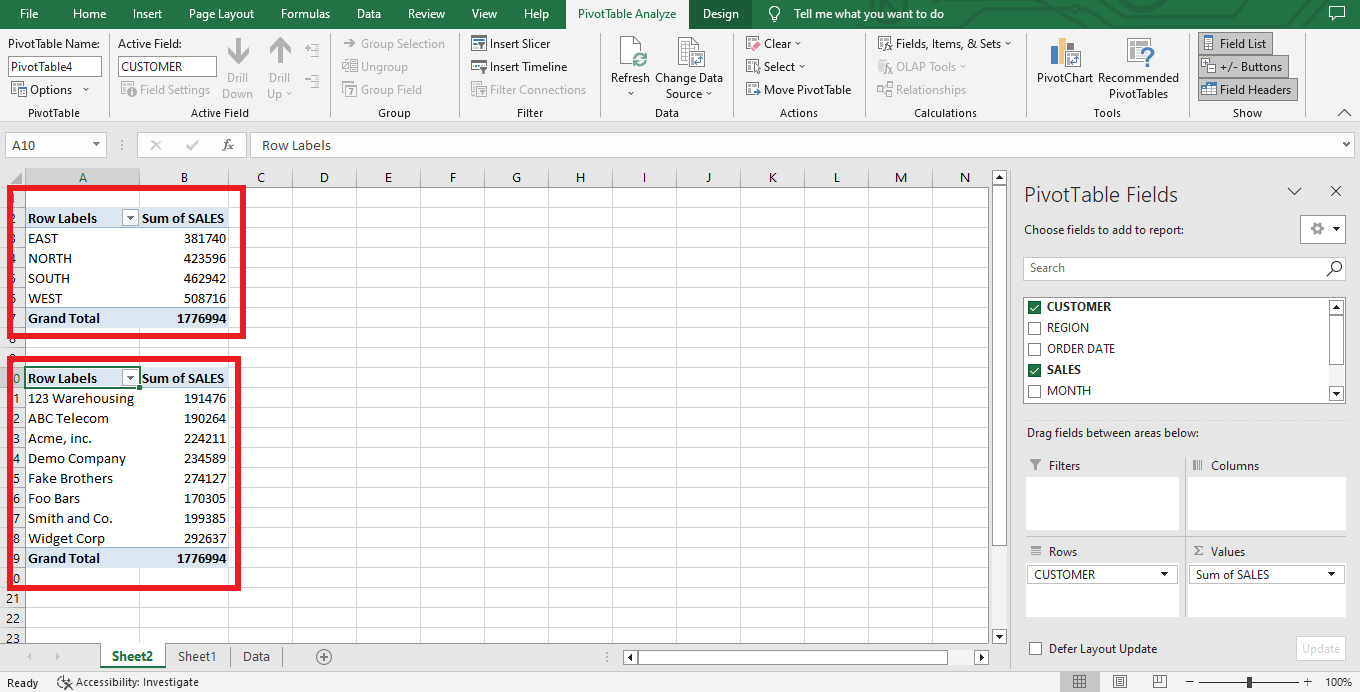
-
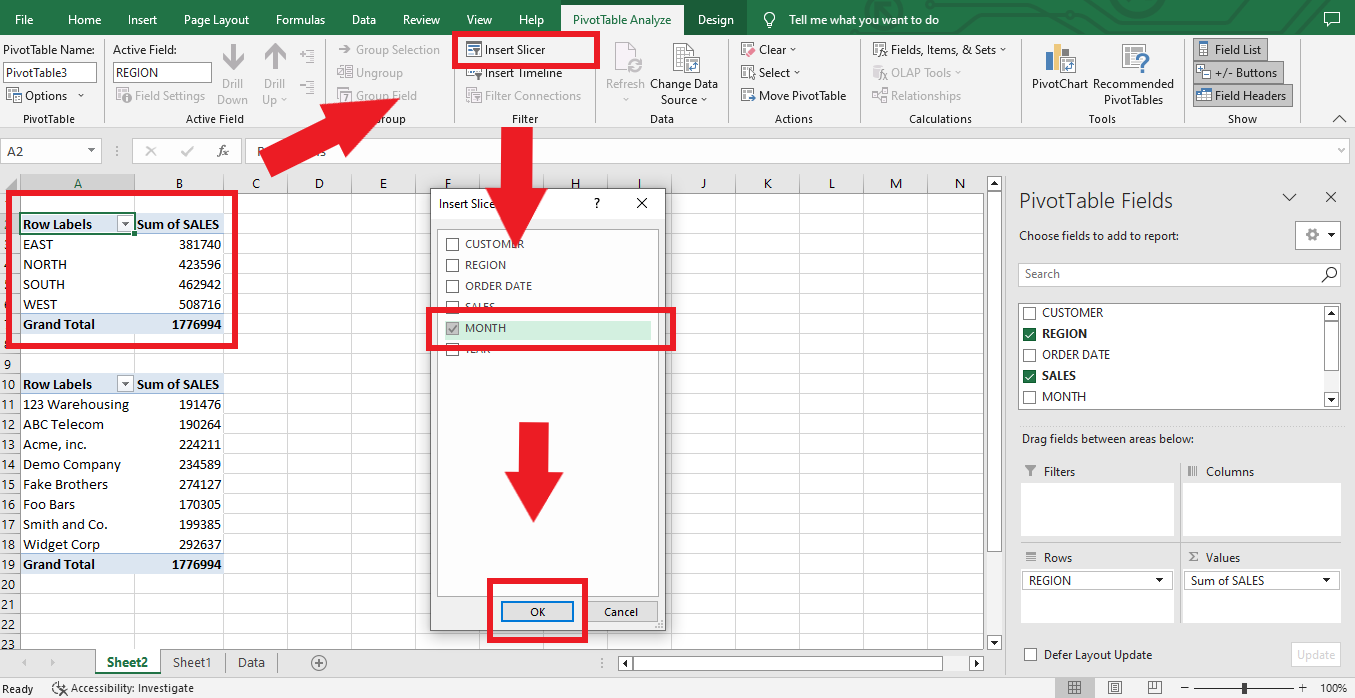
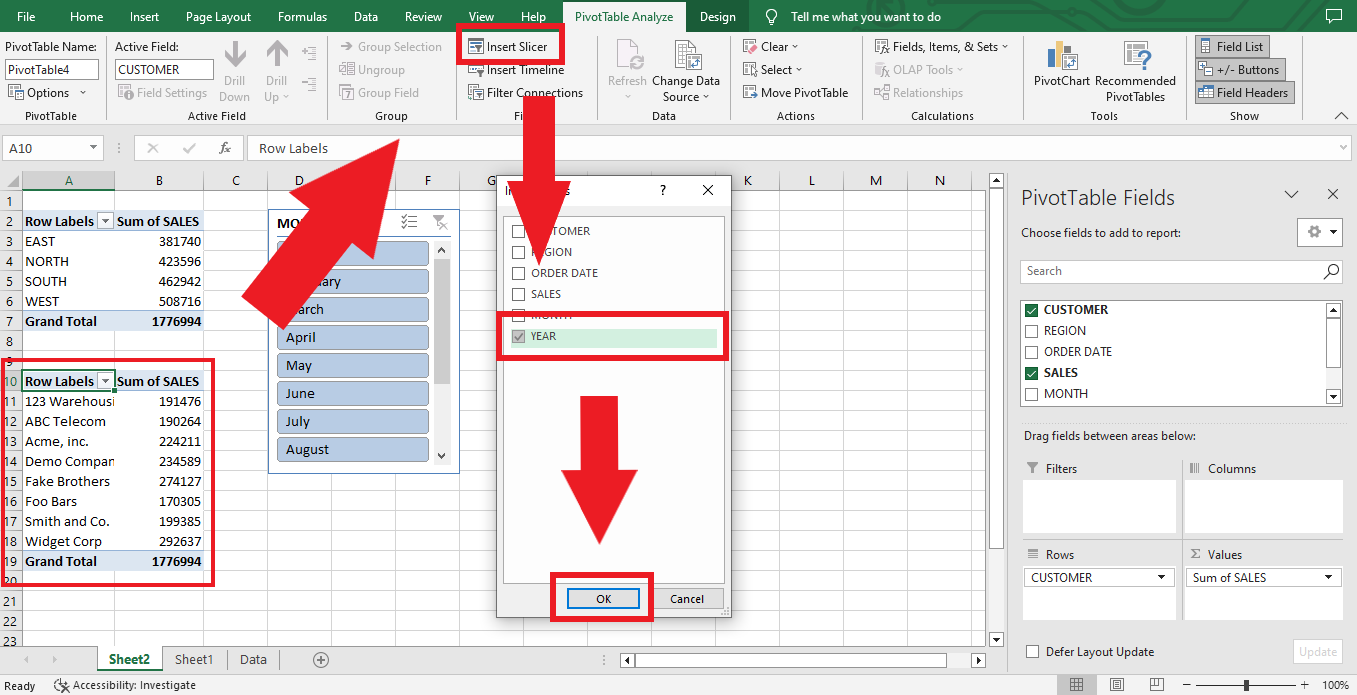
To insert a slicer in Excel for multiple pivot tables, click inside the first pivot table, go to PivotTable Analyze (or Options in Excel 2010), select Insert Slicer, tick "Month" and click OK.
-
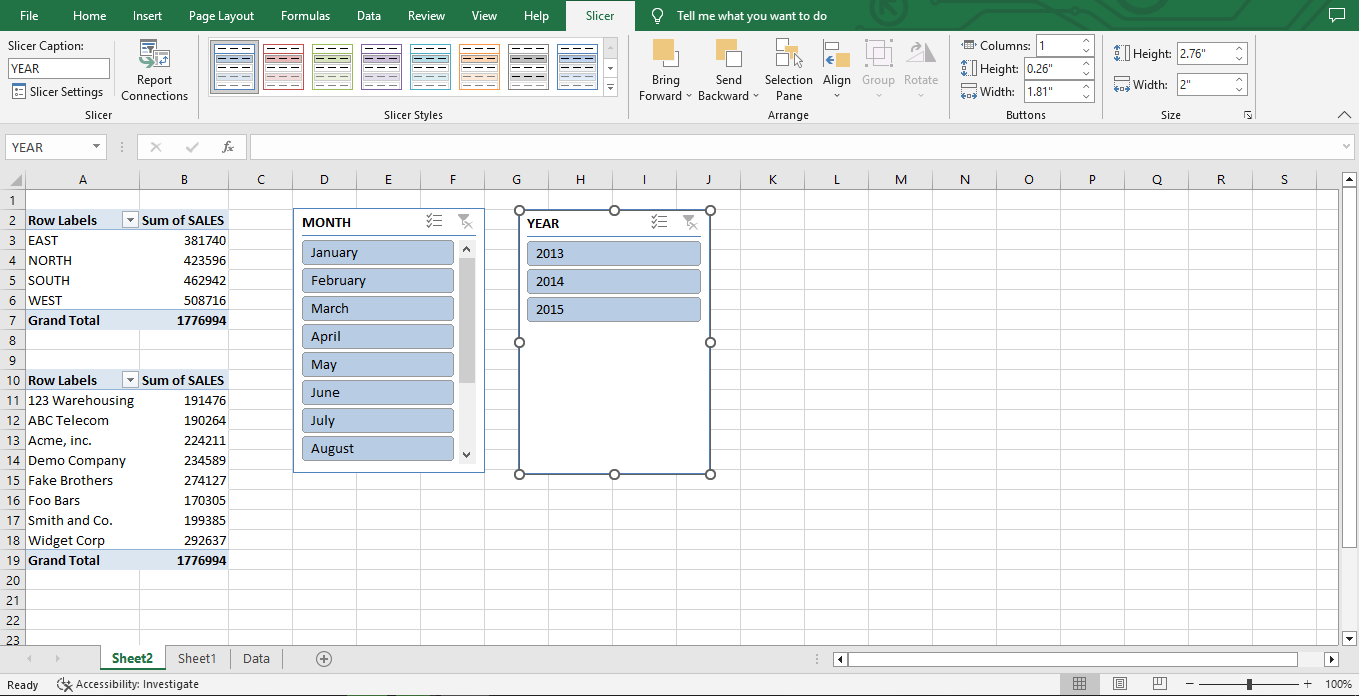
Click inside the second pivot table, go to PivotTable Analyze, select Insert Slicer, tick "Year" and click OK.
-
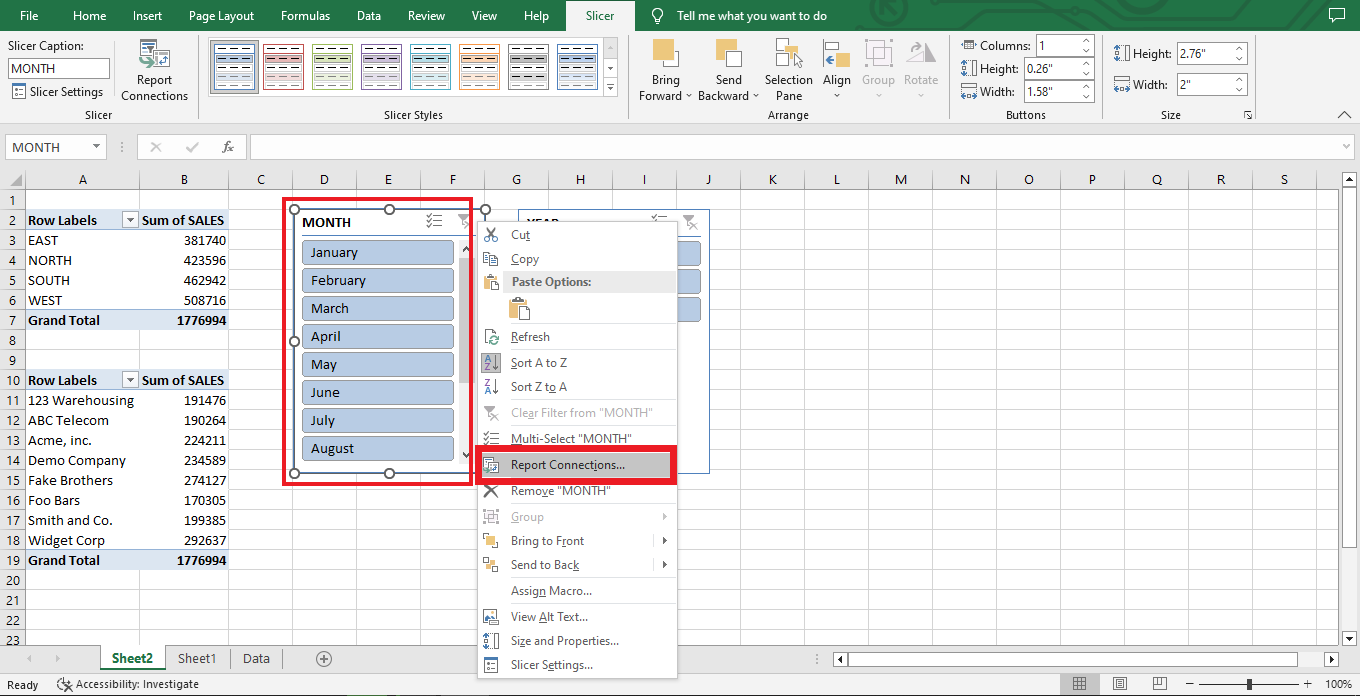
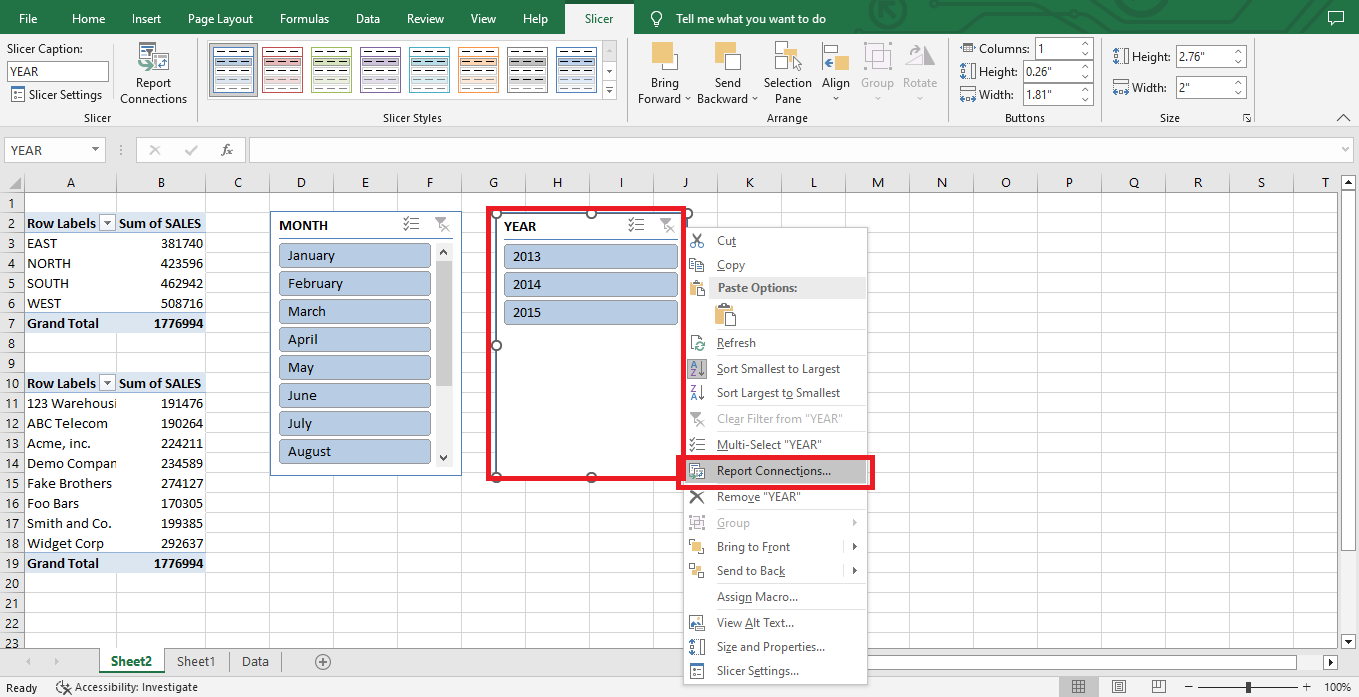
Right-click the first slicer and choose Report Connections.
-
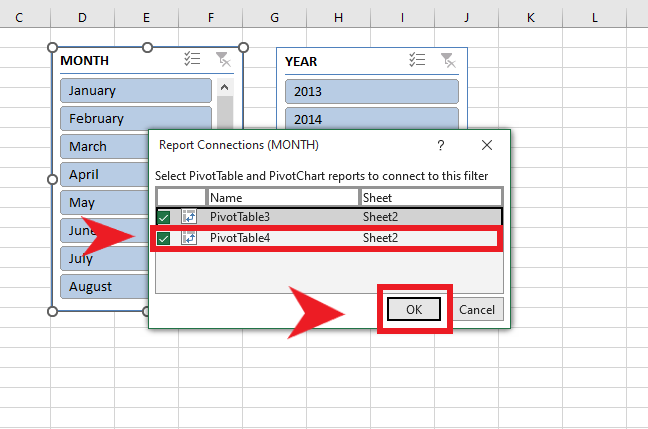
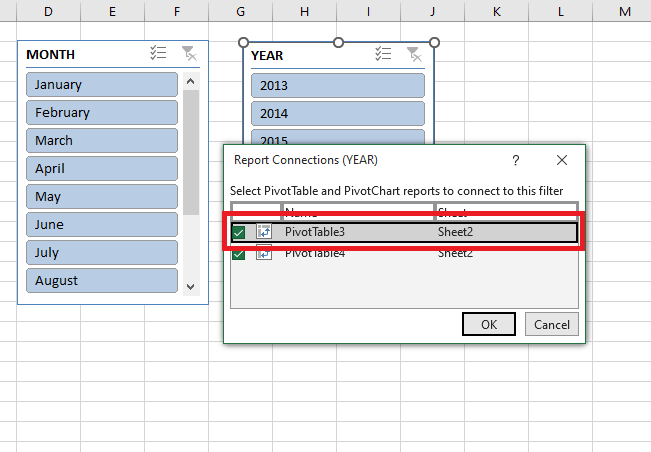
Tick the box for the other pivot table in the Report Connections dialog and click OK. That single action is what makes one slicer for multiple pivot tables work.
-
Right-click the second slicer and choose Report Connections.
-
Tick the other pivot table box and click OK. Both slicers now apply to both reports, so you can filter multiple pivot tables at once from either control.
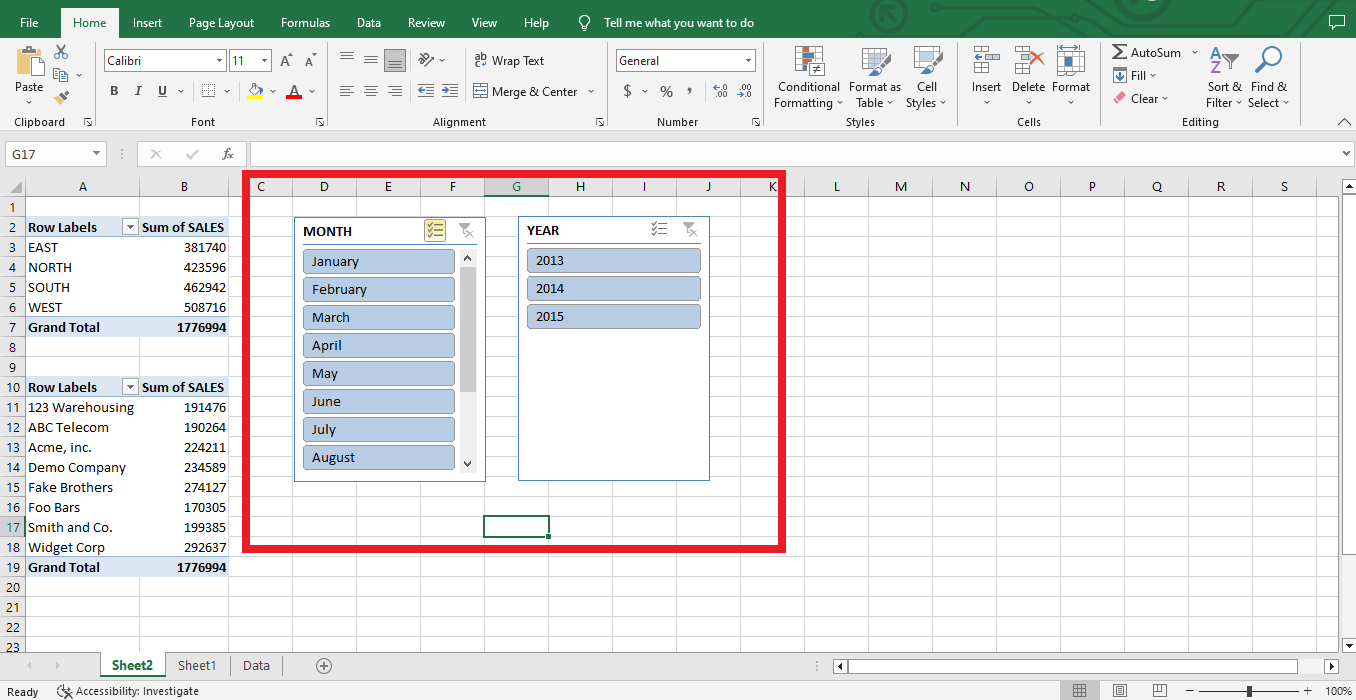
Rule to remember: you never connect a slicer to a slicer. You connect a slicer to pivot tables, one tick box per pivot table, in Report Connections.
Why is my pivot table missing or greyed out in Report Connections?
This is the single most common failure and it is almost never a bug. Report Connections only lists pivot tables that share the same source data, meaning the same underlying PivotTable cache. A pivot table built from a different range, a different named table, or a separate connection does not appear in the list at all.
Three reliable fixes, cheapest first:
- Copy the pivot table instead of building a new one. Select the whole existing pivot table, press CTRL + C, click an empty cell and press CTRL + V, then rearrange the fields on the copy. A pasted copy always shares the original cache, so it will appear in Report Connections.
- Rebuild both pivot tables from one formatted table. Convert your source range to a table with CTRL + T, give it a name, and create every pivot table from that same table name.
- Use the Data Model if the reports genuinely come from separate tables. See the next section.
One side effect of a shared cache is worth knowing before you commit to it: pivot tables that share a cache also share field grouping and calculated items. Group a date field into months in one, and the other one groups too. If your date grouping is misbehaving, see why Excel cannot group dates in a pivot table.
How do you use one slicer for multiple pivot tables from a different data source?
Report Connections cannot bridge two unrelated tables on its own. When the pivot tables come from a different data source, you have to give Excel a relationship between them first, using the Data Model.
- Convert each source range to a formatted Excel table with CTRL + T and give each one a clear name.
- Create each pivot table with Insert > PivotTable and tick Add this data to the Data Model.
- Go to Data > Relationships > New and join the two tables on a column they have in common, for example a Date key or a Product ID.
- Insert your slicer from the shared field, the one that exists in the lookup table both pivot tables now relate to, not from a column that lives in only one of them.
- Right-click the slicer, choose Report Connections, and tick both pivot tables. They will now be listed, because both are built on the same Data Model.
Rule to remember: a slicer can only filter across two data sources if both pivot tables read from the Data Model and the slicer field sits on the table that links them.
How do you link two pivot tables in Excel?
Excel has no command literally called "link pivot tables." When people search for how to link pivot tables, they usually want one of three things, and each has a different answer.
| What you actually want | How to do it in Excel |
|---|---|
| Both pivot tables filter together when I click one control | Connect two pivot tables to one slicer with Report Connections, as shown above |
| Both pivot tables read the same numbers so totals always agree | Build both from the same formatted table, or copy and paste an existing pivot table |
| Combine two separate tables into one report | Add both to the Data Model and create a relationship, then build one pivot table over the model |
| Pull a single figure from one pivot table into another sheet | Use GETPIVOTDATA, which Excel writes for you when you click a pivot table cell in a formula |
Can you connect two slicers to each other in Excel?
No. Slicers do not connect to other slicers. There is no command to combine slicers in Excel or to make one slicer drive another directly. Each slicer connects only to pivot tables.
What people usually mean by connecting slicers in Excel is that two slicers should narrow each other down, so picking "2025" on a year slicer leaves only the months that exist in 2025. You get that behaviour indirectly: point both slicers at the same set of pivot tables through Report Connections. Because they filter the same report, their selections combine, and buttons with no remaining data are dimmed at the bottom of each slicer.
If dimmed buttons are cluttering the panel, right-click the slicer, choose Slicer Settings, and tick Hide items with no data.
How do you connect a pivot table to an existing slicer?
The relationship works in both directions, and sometimes it is faster to start from the pivot table. To connect a pivot table to an existing slicer:
- Click any cell inside the pivot table you want to bring under the slicer's control.
- Go to PivotTable Analyze and click Filter Connections.
- Tick every slicer and timeline that should filter this pivot table, then click OK.
This is the better route when you are adding a new report to a dashboard that already has five or six slicers. One dialog on the new pivot table beats opening Report Connections on every slicer in turn.
Where is Report Connections in each Excel version?
| Excel version | Slicer ribbon tab | Command name |
|---|---|---|
| Excel 2010 | Slicer Tools > Options | PivotTable Connections |
| Excel 2013 and 2016 | Slicer Tools > Options | Report Connections |
| Excel 2019, 2021 and Microsoft 365 | Slicer | Report Connections |
| Excel 2016 for Mac and later | Slicer | Report Connections |
| Excel for the web | Slicer | Report Connections |
In every version listed, right-clicking the slicer gets you to the same dialog without hunting through the ribbon. Microsoft's own reference for the feature is Use slicers to filter data on Microsoft Support.
Slicer troubleshooting table
| Symptom | Cause | Fix |
|---|---|---|
| Insert Slicer is greyed out | The active cell is not inside a pivot table or Excel table | Click a cell inside the pivot table first, then reopen PivotTable Analyze |
| Report Connections does not list my second pivot table | The two pivot tables use different source caches | Copy and paste the first pivot table, or rebuild both from one formatted table |
| Slicer filters one report but not the other | The second pivot table was never ticked in Report Connections | Right-click the slicer, open Report Connections, tick the missing report |
| Slicers are unavailable anywhere in the workbook | The file is saved in the old .xls format, where slicers are not supported | Save as .xlsx or .xlsm and reopen |
| Buttons appear for values that no longer exist | Stale cached items from deleted source rows | Right-click the pivot table, choose PivotTable Options > Data, set "Number of items to retain per field" to None, then refresh |
| Grouping a date in one pivot table changes the other | The two pivot tables share a cache, which is exactly what Report Connections requires | Expected behaviour. If you need independent grouping, the reports cannot share a slicer |
| Slicer selection resets after refresh | The selected item was dropped from the refreshed source data | Check the source range still includes the rows, and use a formatted table so the range expands automatically |
Final thoughts on connecting a slicer to multiple pivot tables
The mechanics take about thirty seconds once the data is right: right-click, Report Connections, tick, OK. Nearly all of the difficulty in this task is upstream of that dialog. If every pivot table in the workbook is built from one formatted table, or from copies of a single pivot table, Report Connections will always show you the full list and the slicer will apply to multiple pivot tables without argument.
You can visit our homepage for more step-by-step guides, or browse our Excel formulas and templates library.
Read Also: Excel Macro Button: What is it and How to Create One.
Frequently asked questions about connecting a slicer to multiple pivot tables
Can one slicer be connected to multiple pivot tables?
Yes. A single slicer can control any number of pivot tables, as long as every one of them is built on the same source data. Right-click the slicer, choose Report Connections, and tick each pivot table you want it to filter.
Why is my pivot table missing from the Report Connections list?
Because it was built from a different source cache. Report Connections only shows pivot tables that share the same underlying data. Copy and paste an existing pivot table to create the new one, or rebuild both from the same formatted Excel table.
Can you use one slicer for multiple pivot tables from different data sources?
Only through the Data Model. Add both source tables to the Data Model, create a relationship between them on a shared key, then build a slicer from the linking field. Both pivot tables will then appear in Report Connections.
How do you filter multiple pivot tables at once?
Connect one slicer or timeline to all of them with Report Connections. After that, a single click on the slicer refilters every connected report at the same time.
Do slicers and Report Connections work in Excel for Mac?
Yes, in Excel 2016 for Mac and later. Slicers were not available in Excel 2011 for Mac. On supported versions, right-click the slicer or use the Slicer tab to reach Report Connections.
Does connecting a slicer to multiple pivot tables make the file bigger?
No, it usually makes it smaller. Connecting reports requires them to share one pivot cache, and one shared cache stores the source data once instead of once per pivot table.
Related Articles:
Excel Cannot Group Dates in Pivot Table: How to Fix It
A Reference Isn't Valid Excel Error | How to Fix this Excel Error?
Want to Make Excel Work for You? Try out 5 Amazing Excel Templates & 5 Unique Lessons
We hate SPAM. We will never sell your information, for any reason.