
Easiest Guide: How To Add A Trendline In Google Sheets
Mar 20, 2023
Do you want an easy way to learn how to add a trendline in Google Sheets?
Learning to add trendlines to compare values in Google Sheets is easier than you think. In this blog post, you'll learn how to add a trendline to any graph or chart in just a few steps.
Read on as we cover the following:
-
What Is a Trendline in Google Sheets
-
Steps to Add a Trendline in Google Sheets
-
Final Thoughts on How to Add a Trendline in Google Sheets
-
Frequently Asked Questions on How to Add a Trendline in Google Sheets
You can also watch this video below if you learn better from tutorials.
What Is a Trendline in Google Sheets?
Trendlines are chart lines that help you understand how the data is changing. The trendlines can also predict what might happen in the future and show how different data points are related.
Charts with trendlines will look better and tell you more. They show patterns in the data that can help you see significant changes.
Read Also: How to Remove Duplicates in Google Sheets

Steps to Add a Trendline in Google Sheets.
-
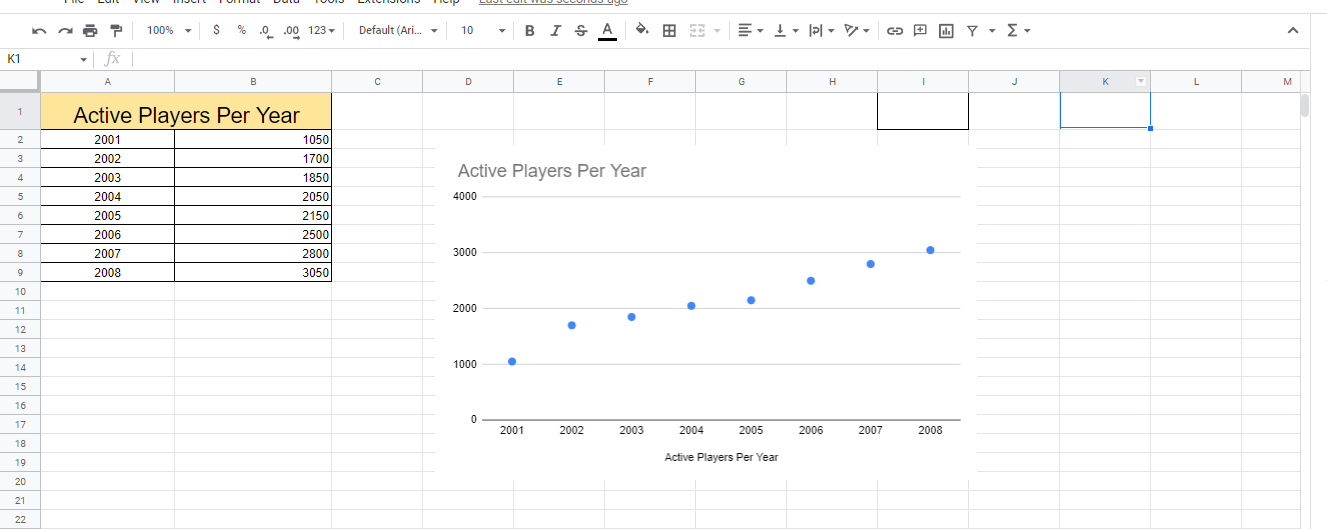
Choose Scatter Chart as your Chart type.
-
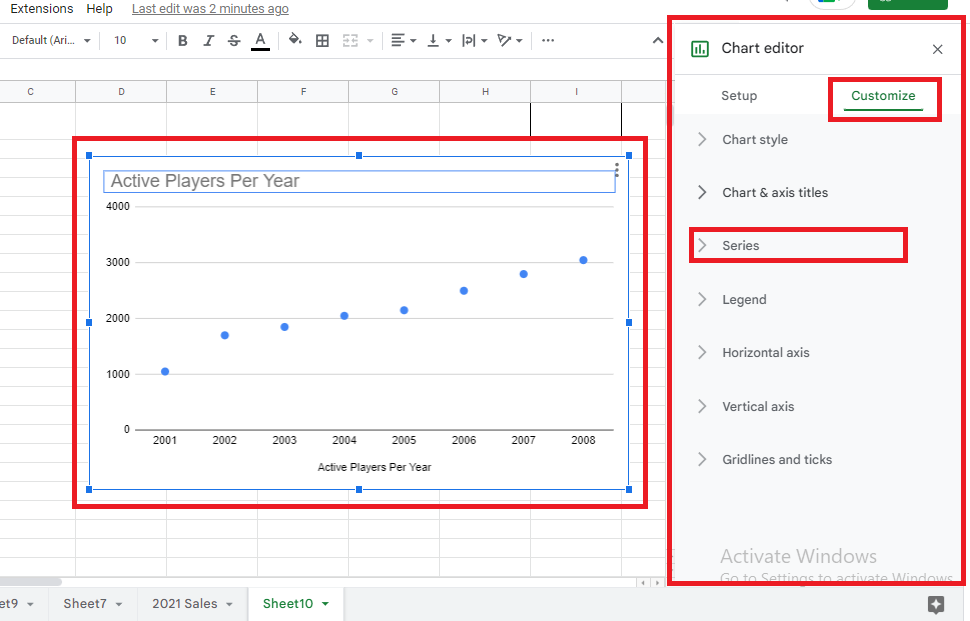
Double-click your Scatter chart. In the "Chart Editor" sidebar, go to the "Customize" tab and click "Series."
-
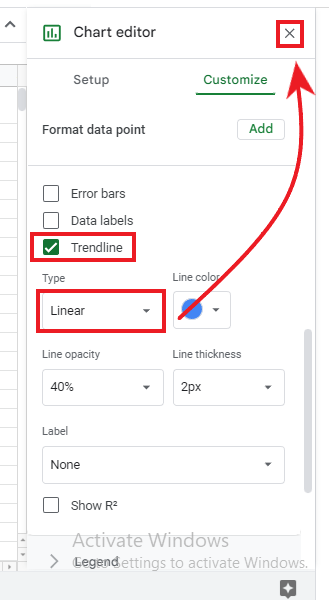
Check the "trendline" option, pick the Linear trendline type from the drop-down menu, and click the "X" button at the top-left corner.
-
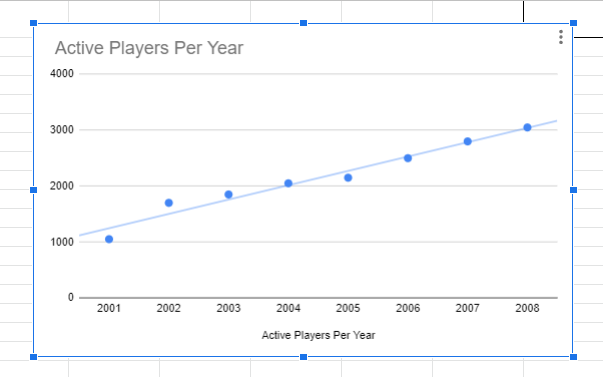
Google Sheets will add a straight line that makes the direction of a data series. This is also known as the Moving Average Trendline.
Read Also: How to Make a Scatter Plot in Excel (XY Chart)
Final Thoughts on How to Add a Trendline in Google Sheets.
Adding a trendline in Google Sheets can function like a picture that helps you understand data. Adding a trendline is crucial when you want to comprehend your data better.
For more easy-to-follow Google Sheets guides, visit Simple Sheets. Get Excel and Google Sheets templates by reading the related articles below!
Frequently Asked Questions on How to Add a Trendline in Google Sheets:
Can I use a column chart before adding a trendline?
Yes, you can. But scatter charts are more effective. After all, a column chart blocks some parts of the trendline, which may make it difficult to analyze data.
Should I use the Trend function before making a graph with a trendline?
Yes. The Trend function will help you figure out what might happen in the future with your data. It enables you to look at trends.
Can I add a trendline for multiple charts in Google Sheets?
To add a trendline to multiple charts:
-
Go to the Chart Editor, look for the Customize option, and click on it.
-
Select the data series wherein you want to add a trendline.
-
Check the box next to the type of trendline you wish to use.
Related Articles:
Excel Workbook vs. Worksheet: What's the Difference?
Want to Make Excel Work for You? Try out 5 Amazing Excel Templates & 5 Unique Lessons
We hate SPAM. We will never sell your information, for any reason.

