
Mind Blowing Yet The Easiest Guide For T-Test In Excel
May 05, 2023
Are you trying to figure out how T-TEST works in Excel and need help understanding it?
Look no further! This comprehensive guide will break down the basics of running a T-test in Microsoft Excel to easily apply statistical inference in your data analysis. We'll go over everything from understanding a T-test to calculating its goodness of fit using reports and graphs.
Get our free Excel formulas cheat sheet
Plus new tutorials and template drops. Enter your email and we'll send it over.
Read on as we cover the following:
-
What is T-TEST in Excel?
-
Learn to use the T.TEST function in Excel.
-
Final Thoughts on T-TEST In Excel
-
Frequently Asked Questions on T-TEST In Excel

What is T-TEST in Excel?
The T-TEST function in Excel is a hypothesis test that helps calculate the likelihood of a significant difference between two data sets, even if they come from the same population with the same mean. It considers whether the data sets are one-tailed or two-tailed distributions with equal or unequal variance.
T-TEST function formula in Excel.
Here is the formula for the T.TEST function in Excel:
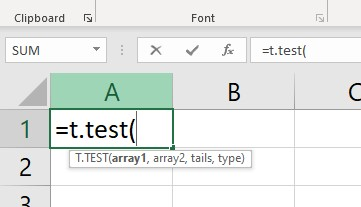
The T.TEST formula requires four types of arguments:
Array1: When using T.TEST, use numbers instead of words. Trying to use words will give you an answer that says "#VALUE!".
Array2: This is the second group you are comparing to the first.
Tails: This refers to the tails of a distribution. There are two types of distribution tails: One-tailed and Two-tailed.
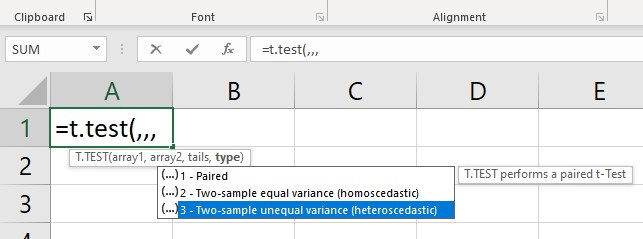
Type: There are three types of T.Test available in statistics.
-
Paired samples T-TEST means that there are two sets of information. We look at those two sets' mean (average) to see if they are the same.
-
The two-sample equal variance test checks for an equal variance of means between two groups.
-
The two-sample unequal variance looks to see if the differences between two sets of numbers are different.
Excel recently added a new formula called T.TEST. But older versions still have the T-TEST formula. It is still available in newer versions to help make sure everything works together.
Learn to use the T.TEST function in Excel.
The T.TEST function in Excel is easy to use. We will go over how it works with examples.
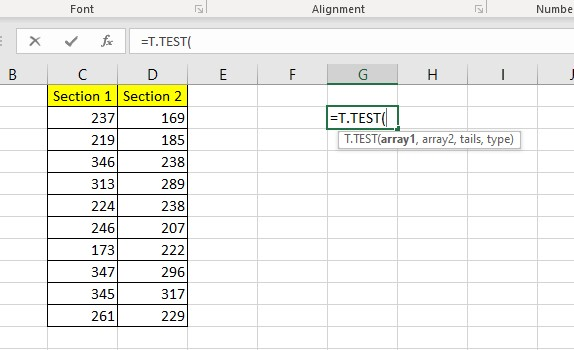
T-TEST function Example #1
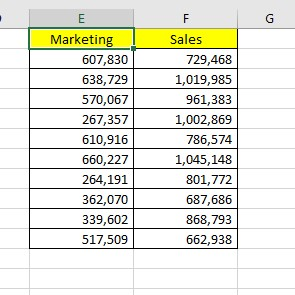
Let's use a data sample set to understand how T.TEST works.
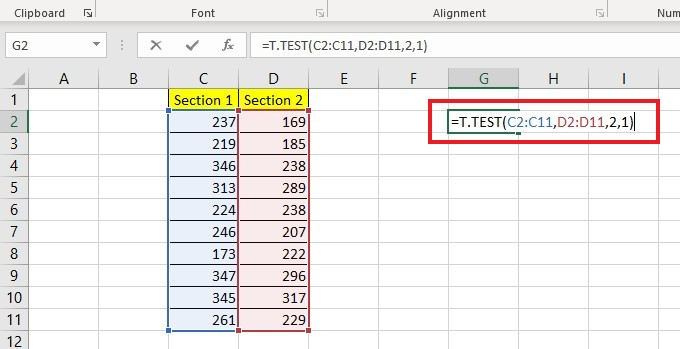
Here are the scores for Section 1 and Section 2 of a school's examinations. We will use T.TEST to discover if there is a significant difference between the scores.
-
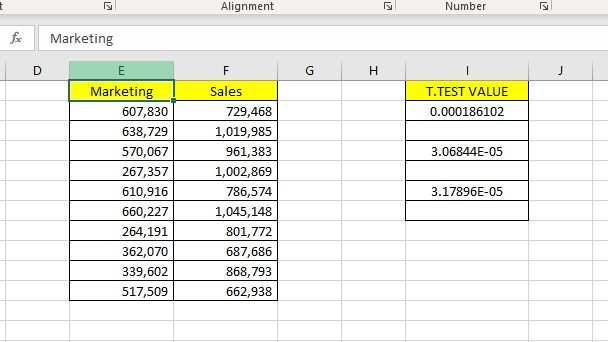
Select a cell, then type the T.TEST function.
-
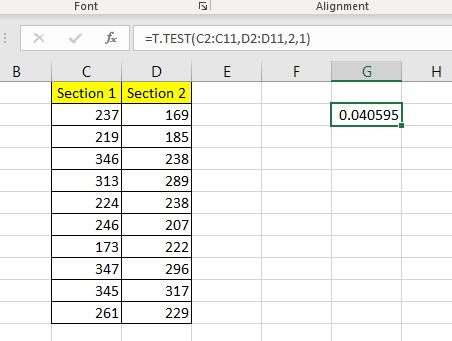
The first test is a Paired test.
-
Press the Enter key.
-
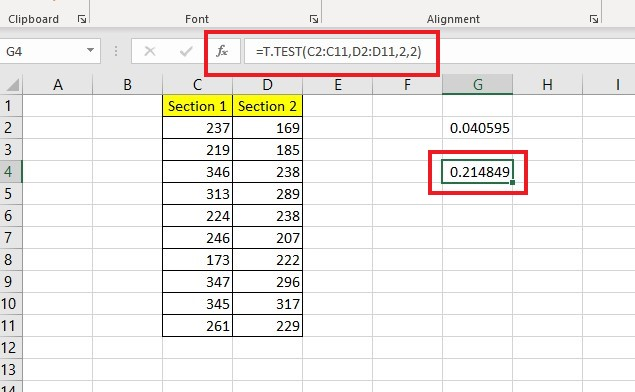
The second test is an instance of the Two Samples' equal variance type.
-
The third test showed a Two Sample unequal variance.
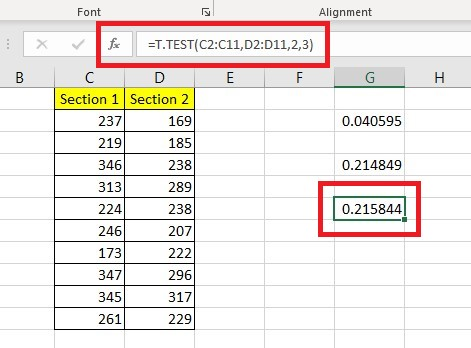
The returned value you get is called the P-value. We can infer that the two data sets have different means if the P-value is less than 0.05. The two means are not significantly different if it is greater than or equal to 0.05.
T-TEST function Example #2
I have the salary data for two departments and want to determine whether there is a significant difference between the means of their salaries.
-
To compare data sets, use the T.TEST function.
-
Use the T.TEST function to compare the results and analyze any differences.
To perform a T.TEST using the Analysis Tool Pack, follow these steps in Excel:
-
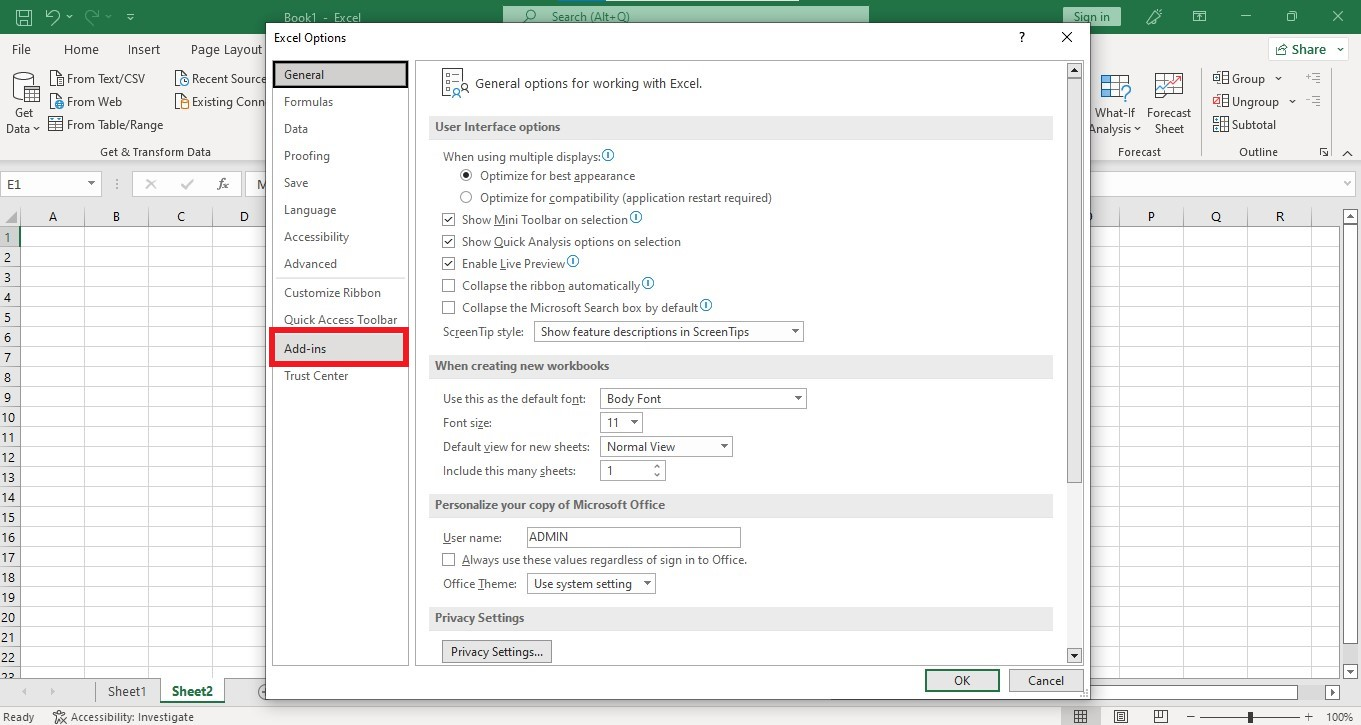
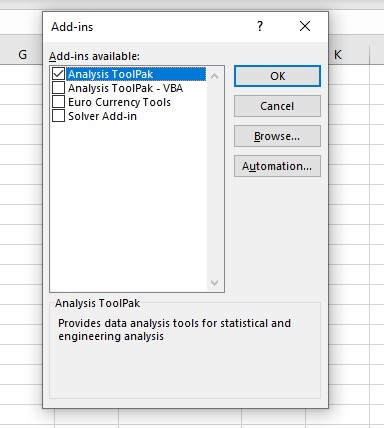
Go to the Excel options under the File tab, and click Add-Ins.
-
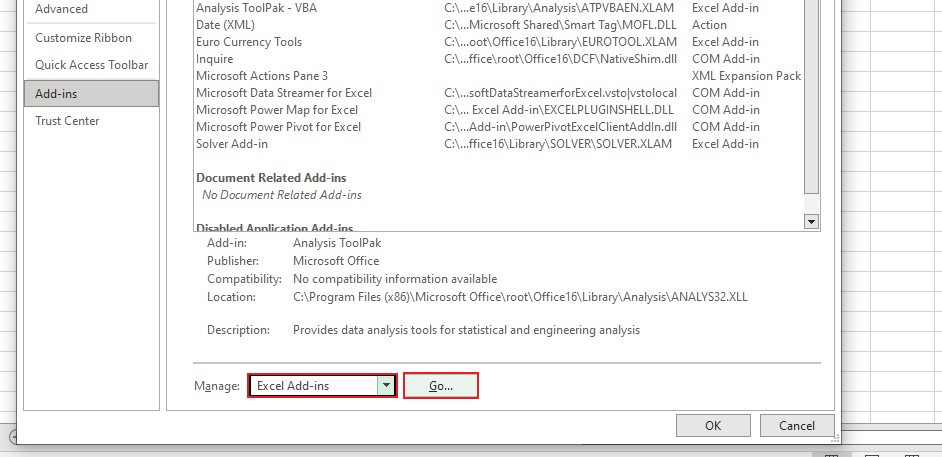
In the Manage Drop-down list, choose Excel Add-Ins, then click the Go button.
-
Check the Data Analysis Toolpak and click the OK button.
-
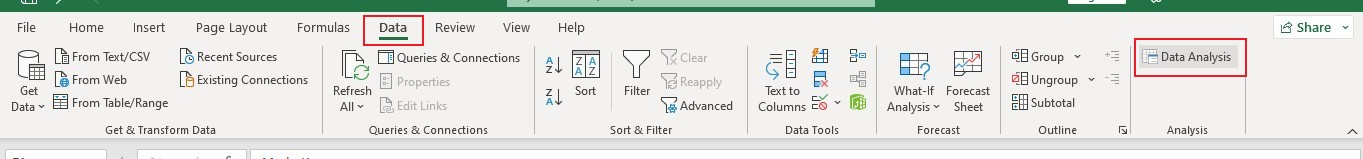
Go to the Data tab under the Analysis Group, and click the Data Analysis option.
-
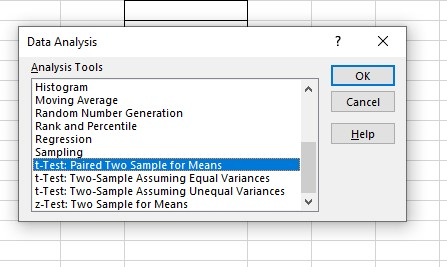
Choose T-TEST: Paired Two Sample For Means. Click OK.
-
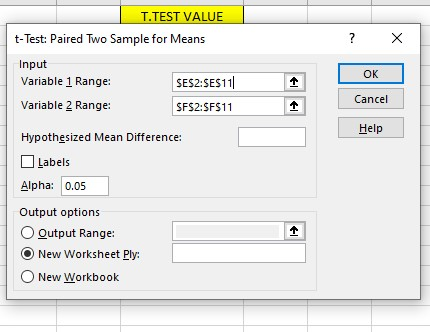
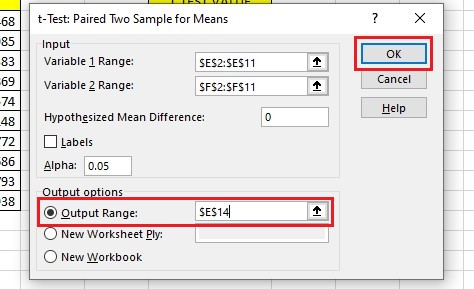
Select a range of cells for Variable 1 and 2.
-
Type zero in Hypothesized Mean Difference.
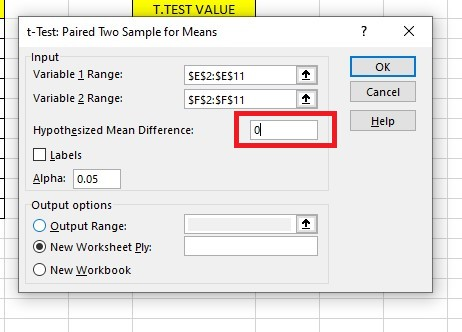
-
Select an Output Range, then click the OK button.
The Tool will show a detailed report.
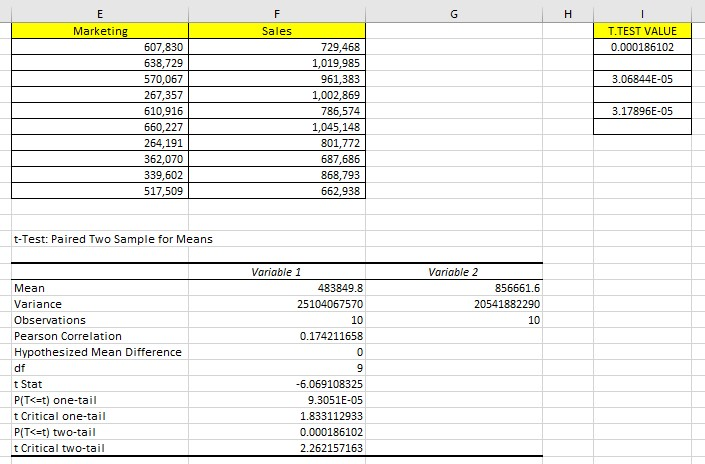
The analysis will provide each data set's mean, variance, number of observations, correlation, and P-value.
It is important to look at the P-value (located in cell B26), which is 0.000186102 - much lower than the expected value of 0.05. The data is considered significant if the P-value is less than 0.05.
Important details to remember!
-
Using words instead of numbers with the T.TEST will give you an answer that says "#VALUE!". This means you have an error.
-
An error of "#NUM!" will occur if the tails value differs from 1 or 2.
-
To better understand, learn the distinction between a one-tailed and two-tailed test.
-
The samples are assumed to have been selected randomly from the larger dataset.
-
A standard P-value of 0.05, meaning 5%, indicates that data is significant if the variance is less than 5%.
Final Thoughts on T-TEST In Excel
In summary, working with the T-test in Excel can be an invaluable skill for any data analyst. The process allows for the gathering and organizing of data, along with a reliable method for testing assumptions and finding meaningful results.
Visit Simple Sheets for more easy-to-follow guides, and remember to visit the related articles section of this blog post. For the most straightforward Excel video tutorials, Subscribe to Simple Sheets on Youtube!
Frequently Asked Questions on T-TEST In Excel
If I use a one-sample T-Test, what will it do?
To use a one-sample T-TEST, you need to divide the mean difference by the standard deviation of the sampling distribution. You can calculate it by dividing the sample's standard deviation by the sample size's square root.
If I have a paired sample T-TEST, what is the best way to use it?
The best option is to find the average of the Pre and Post Intervention measures for each data.
Can I select the direction of the tail in Excel, either the Left or Right tail?
If you obtain significant results, double-check that they align with your chosen direction. Although you cannot explicitly state the direction, the only concern is that you may need to perform both one-sided tests, which you should watch for.
Related Articles:
How To Match Data From Two Excel Sheets In 3 Easy Methods
How to Calculate Confidence Interval in Excel: Easy-to-Follow Steps
Want to Make Excel Work for You? Try out 5 Amazing Excel Templates & 5 Unique Lessons
We hate SPAM. We will never sell your information, for any reason.

