
The Simple Guide: How To Create A Scorecard In Google Sheets
May 11, 2023
Are you ready to learn how to create a scorecard in Google Sheets to track progress easily?
Companies commonly deal with a massive array of metrics and indicators that can be difficult to track in an organized way.
Thankfully, there is a solution: creating scorecards using Google Sheets! This tool allows users to create up-to-date scorecards ranging from simple goal summary sheets to sophisticated visualizations of complex objectives without sacrificing accuracy or scalability.
This blog post will discuss why scorecards are important and how you can quickly build one in Google Sheets!
Read on as we cover the following:
-
What Is a Scorecard Chart in Google Sheets?
-
How to Create a Scorecard in Google Sheets
-
Show Comparisons on Scorecard Charts in Your Spreadsheet
-
Customize a Scorecard Chart in Google Sheets
-
Final Thoughts on How to Create a Scorecard in Google Sheets
-
Frequently Asked Questions on How to Create a Scorecard in Google Sheets

What Is a Scorecard Chart in Google Sheets?
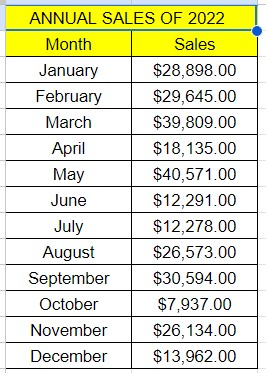
Scorecard charts in Google Sheets present the report of a single metric. They commonly highlight key performance indicators (KPIs). You can also use them to show how values change over a specific baseline value.
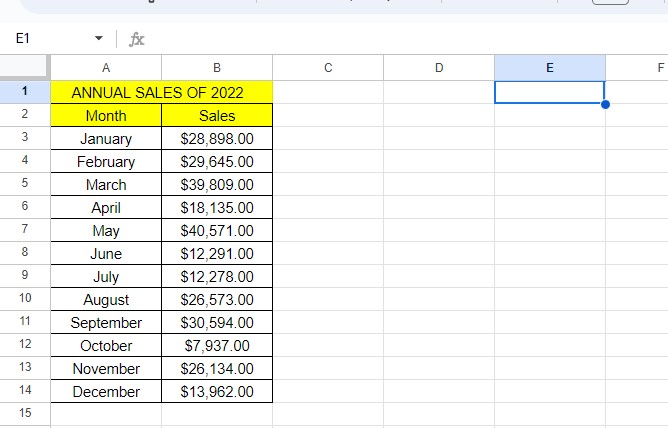
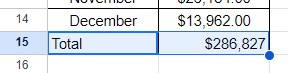
In our example below, the data set displays the monthly net gain/loss for each month of the year 2022, from January through December:
Create Scorecard Charts in Google Sheets
To make a Scorecard chart, follow the steps below:
-
Select an empty cell outside the sales data.
-
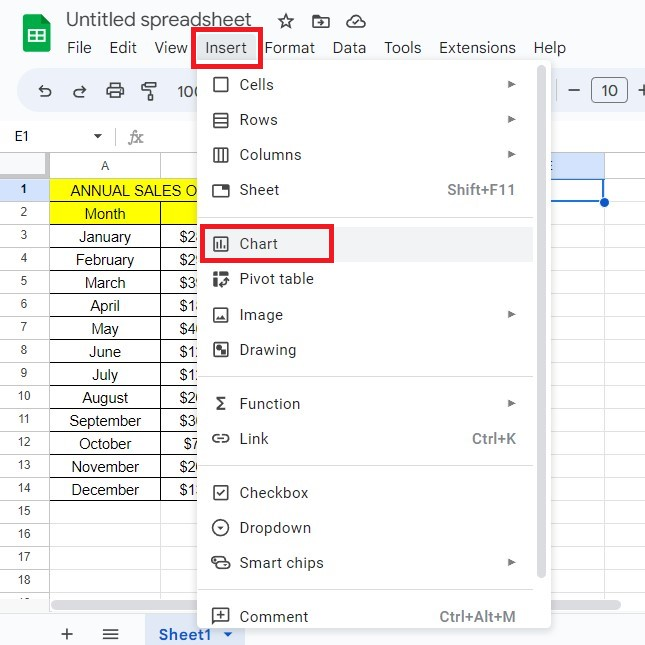
Click the Insert tab and select Chart. You will see a blank chart and the Chart editor on the right side.
-
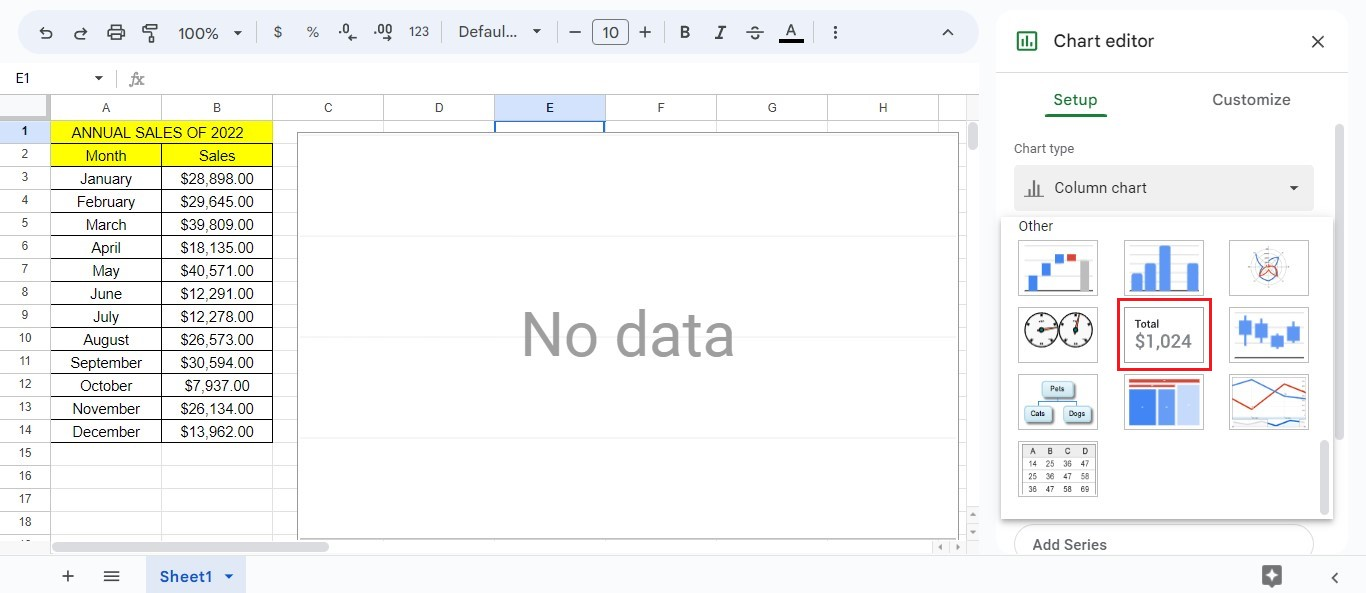
To select the Scorecard chart on the Setup tab, select the down arrow under Chart type and choose Scorecard under Other.
-
Add an Annual Total Sales row.
Your scorecard chart is currently empty. To populate the appropriate cell in the chart, you can either display data from a single cell or show a summary of data from multiple cells.
Displaying Information from a Single Cell
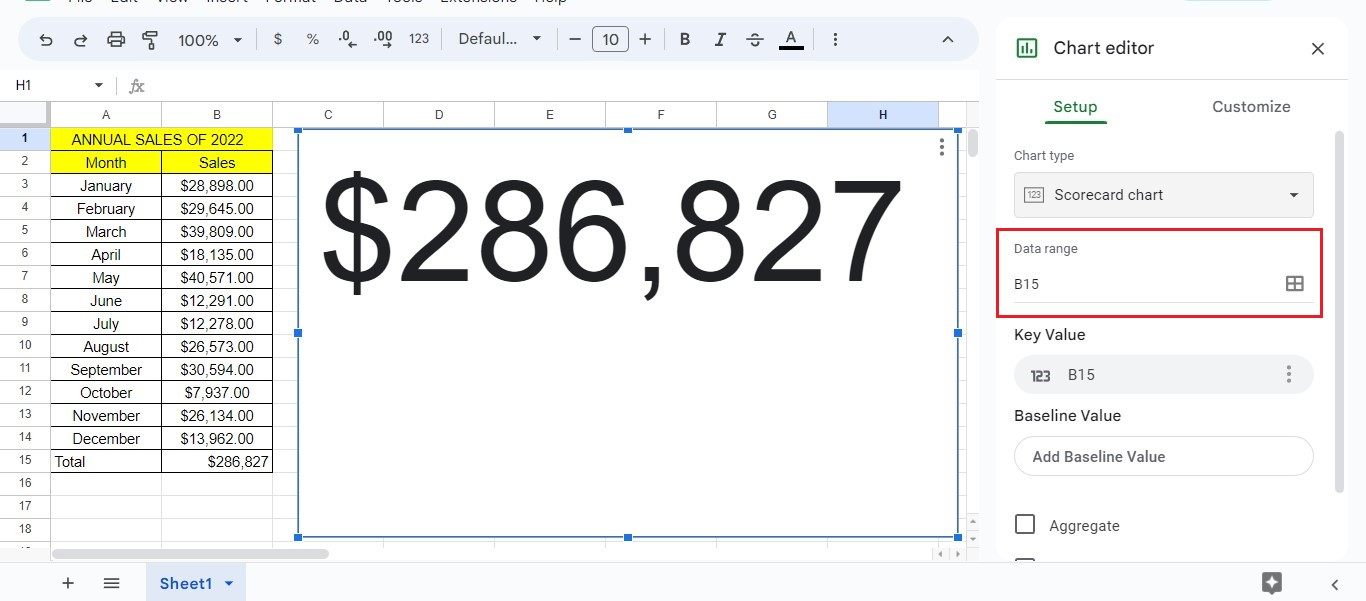
Using our sample dataset, we must retrieve the value from a single cell to display the average net gain/loss from January to December 2022.
-
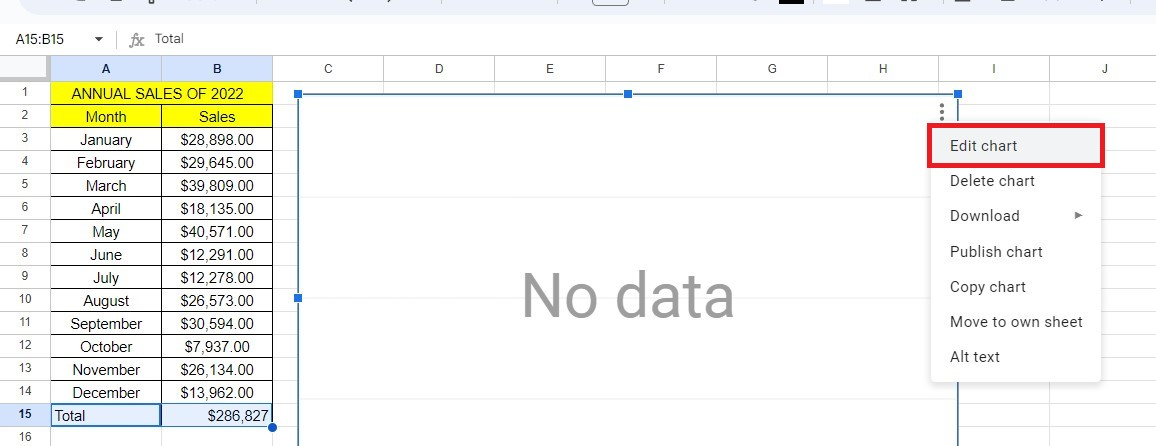
To access the chart editor, choose the three dots icon at the right corner of your scorecard chart and then select "Edit chart."
-
To modify the key value on the scorecard chart, navigate to the Setup tab and manually edit the value in the data range cell. Once you're done, press Enter.
You can resize the scorecard chart by dragging its four corners.
Displaying Information from Multiple Cells
Scorecard charts can summarize data from different cells, including metrics such as average, count, sum, maximum, median, and minimum values. Follow these steps:
-
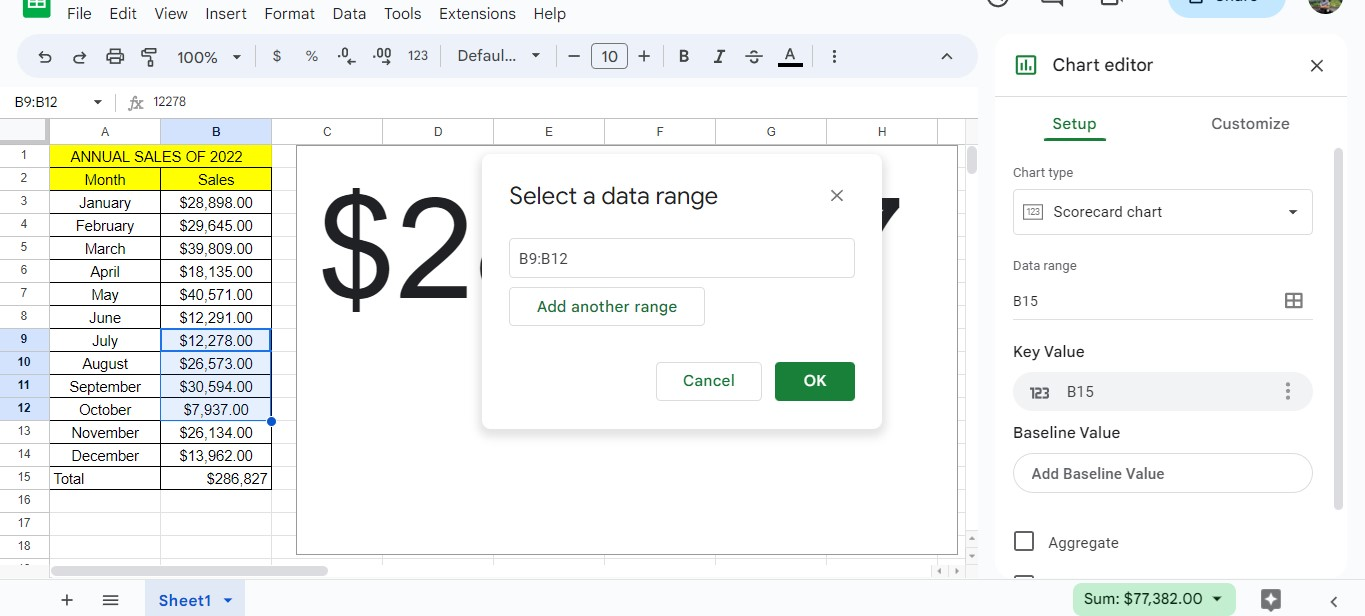
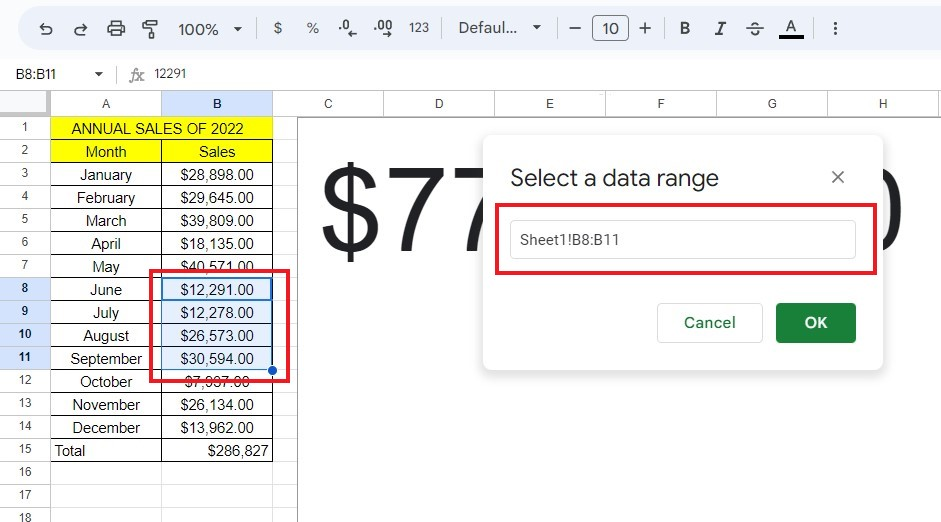
Select the rectangle at the top of the "Select a Data range" menu to summarize multiple cells on your dataset. Then, choose the cells you want to include and press OK.
-
To choose from different measures, please click the up arrow menu on the Setup tab of the Chart Editor and then select Aggregate.
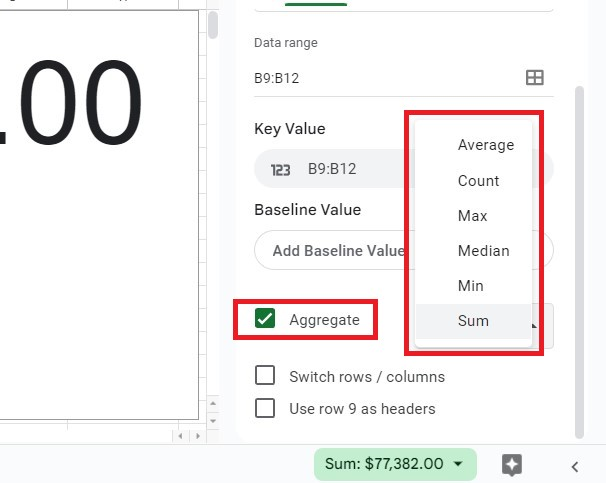
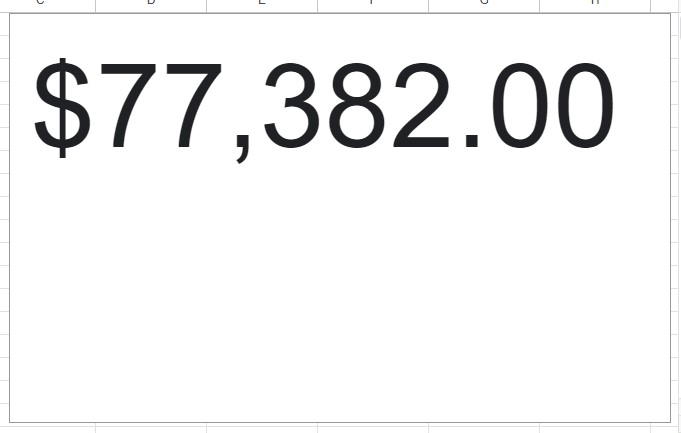
Google Sheets will provide an updated scorecard chart.
Show Comparisons on Scorecard Charts in Your Spreadsheet
You can use the Scorecards can compare two sets of data or data ranges by highlighting and comparing a key value to a baseline or two ranges.
-
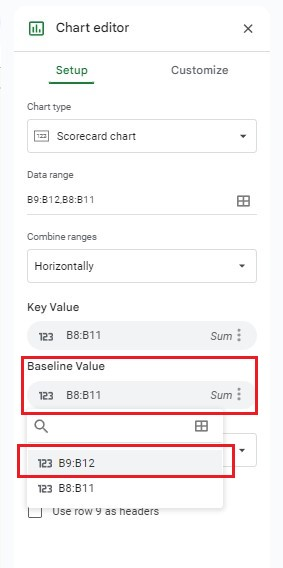
To select the Baseline Value, select Key Value and choose the Select data range menu icon.
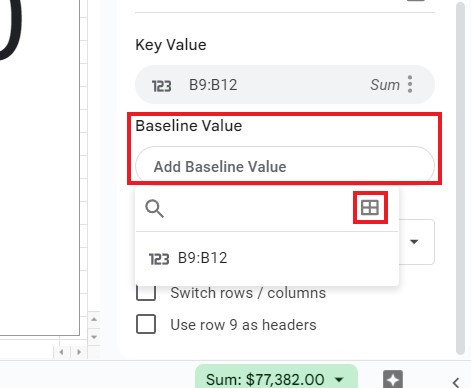
-
To select cells for comparison, use the "Select a Data range" menu and either type in or choose the cells you want.
-
To change the aggregate measure, click the measure option to the left of the baseline value. Select your preferred measure.
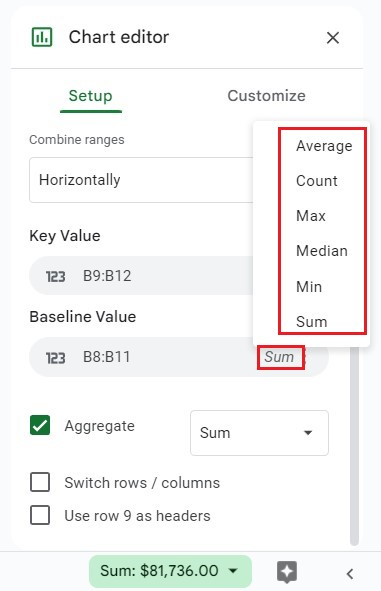
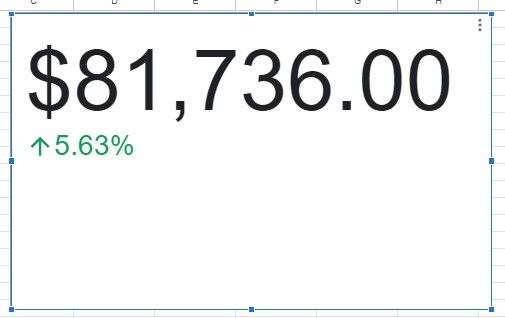
After completing the steps, you'll have a scorecard that includes performance analysis and comparison.
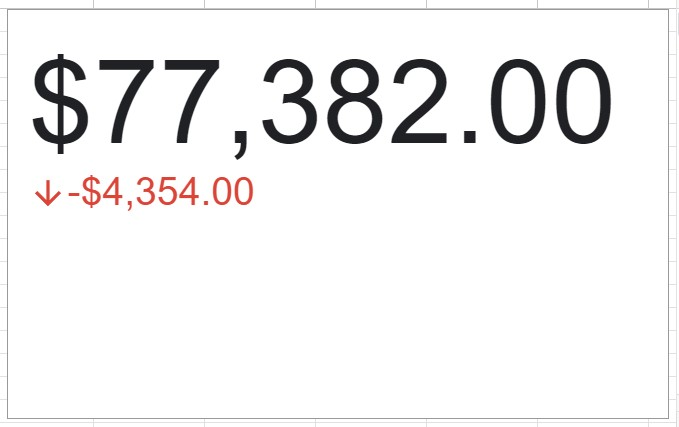
Our scorecard shows the total revenue and net loss from June to September.
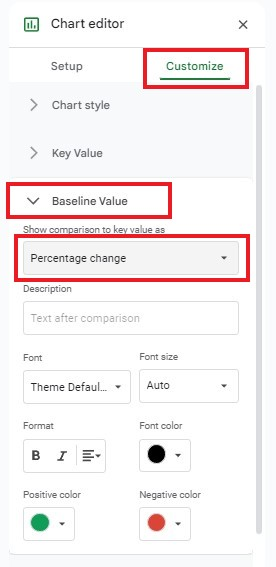
Formatting the Scorecard Comparison
You can compare the key value and the baseline value as a comparison number as an absolute change or as a percentage change. To change the comparison scorecard presentation:
Click Customize in the Chart Editor to modify the font style, size, and colors.
Switching the Scorecard Key Value and the Baseline Value in Google Sheets
When you analyze data, you may switch between two datasets, focusing on the key or specific metric and your baseline value.
The data cell or cells in Google Sheets are saved in your data range after you create a spreadsheet or a scorecard. Select the range under their respective options to switch the key and baseline values.
Switch Key Value to Baseline Value:
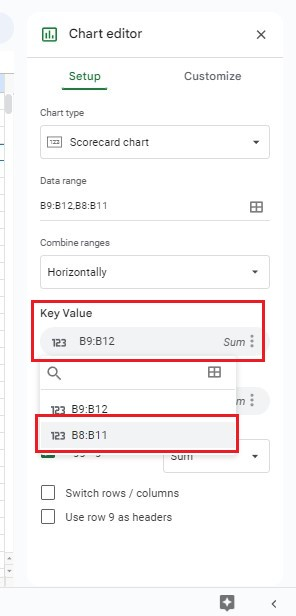
Switch Baseline Value to Key Value:
The above example scorecard chart shows the percentage net gain.
Customize Scorecard Chart in Google Sheets
Adding titles to your scorecard chart can improve its presentation.
To add a chart title to the top menu of your chart, follow these steps:
-
Click the Chart editor and go to the Customize tab.
-
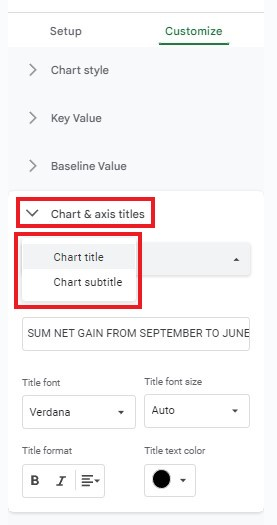
Look for the Chart & axis titles section. Select the arrow menu next to the first option and choose one of the two choices available.
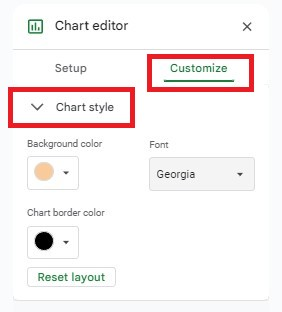
To Change the Chart Style:
Go to the Customize tab, then click Chart Style.
Automatic Scorecard Charts
Scorecard charts can be automated. So, changing the values of cells linked to your scorecard chart will automatically update its values.
Final Thoughts on How to Create a Scorecard in Google Sheets
Creating a scorecard in Google Sheets can be an incredibly useful tool to keep track of your progress and successes, whether for personal goals or organizational objectives.
It is simple to set up and involves the following:
-
Creating a sheet or document.
-
Filling in the information you wish to track.
-
Adding formulas or calculations as necessary.
For more Google Sheets easy-to-follow guides and the latest Google Sheets templates, visit Simple Sheets now! and the related articles section of this blog post.
Don't forget to Subscribe to Simple Sheets on YouTube for more easy-to-follow Google Sheets video tutorials!
Frequently Asked Questions on How to Create a Scorecard in Google Sheets
How can I benefit from a Scorecard System?
Scorecards are beneficial tools that help you translate the specific goals and track the implemented strategy. They also consider operational issues and are designed to focus on your strategy and future goals.
Are there any difficulties when using a scorecard?
If you're using a balanced scorecard, you might encounter the following issues:
- Vague and misaligned metrics
- Inefficient data collection and reporting
- Lack of a formal structure for reviews
- Lack of process improvement methodology
- Heavy reliance on internal operations
How can implementing a balanced scorecard enhance the performance of my organization?
A balanced scorecard (BSC) is a business planning tool to prioritize products, projects, and services, communicate goals and targets, and plan daily operations.
Related Templates
Human Resources Template Bundle
Supply Chain and Operations Template Collection
Want to Make Excel Work for You? Try out 5 Amazing Excel Templates & 5 Unique Lessons
We hate SPAM. We will never sell your information, for any reason.

