
Calculate P-Value In Excel: Everything You Need To Know
Jun 19, 2023
Do you want to learn how to calculate the p-value in Excel?
The p-value helps decide if two sets of data are different. Moreover, it is essential for anyone dealing with numbers and statistics.
Fortunately, Microsoft Excel makes this process incredibly easy—you only need to put your data correctly and follow simple steps.
This blog post teaches you how to calculate a p-value in Excel. This way, you can confidently interpret results from any statistical tests.
Read on as we cover the following:
-
What Is P-Value?
-
How to Use the Analysis Toolpak in Calculating the P-Value
-
Use the T-TEST Function to Calculate the P-Value
-
Final Thoughts on Calculate P-Value in Excel
-
Frequently Asked Questions on Calculate P-Value in Excel

What Is P-Value?
In hypothesis testing, the p-value describes how a value's statistical significance is measured.
Moreover, it plays a role in determining the validity of a null hypothesis, with a range of 0 to 1.
A lower p-value indicates a higher likelihood that the null hypothesis is incorrect, increasing the chances that the alternative hypothesis is true.
Meanwhile, a higher p-value indicates a lower chance of rejecting the null hypothesis, suggesting that the results are more likely due to chance.
The p-values measure
The p-value spans from 0 to 1 and can be expressed as a decimal, such as 0.5, or as a percentage, such as 50%.
There are three levels to measure the significance of a p-value.
-
Significant: The result is equal to or less than 5% (0.05).
-
Marginally significant: The result is between 5% (0.05) to 10% (0.10).
-
Insignificant: The result is more than 10% (0.10).
The p-value determines whether the null hypothesis is valid or not.
How to Use the Analysis Toolpak in Calculating the P-Value
You can find the Excel p-value using two methods. The first method involves using the T.test tool located in the Analysis ToolPak.
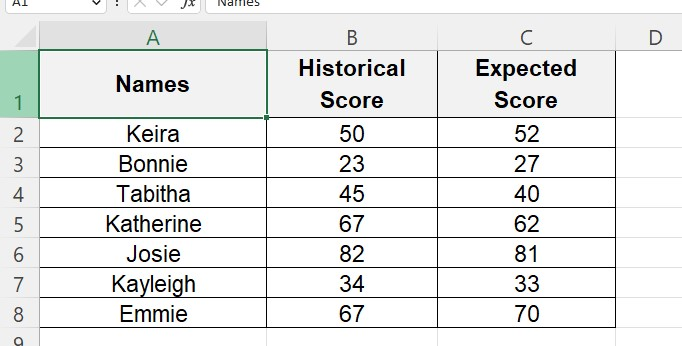
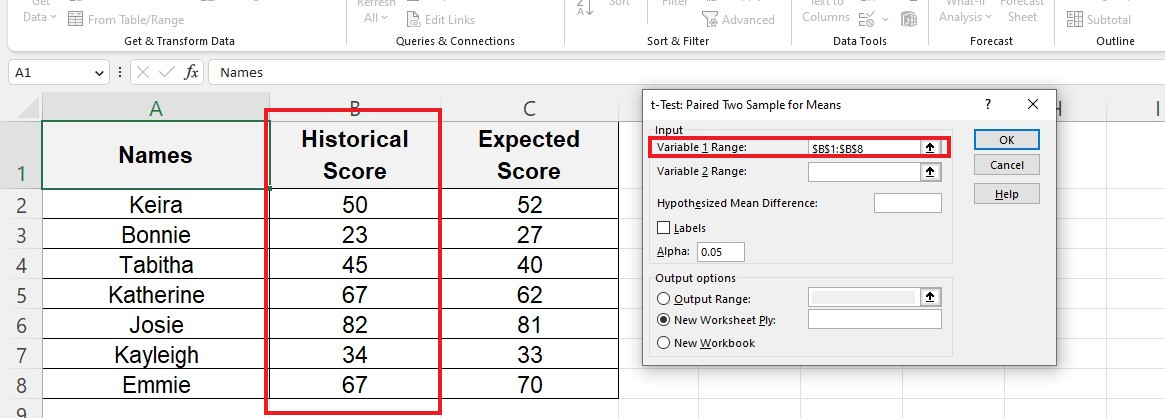
In our example, we'll use a group of students' actual and expected scores.
Follow the steps below to add Analysis Toolpak to your workbook:
-
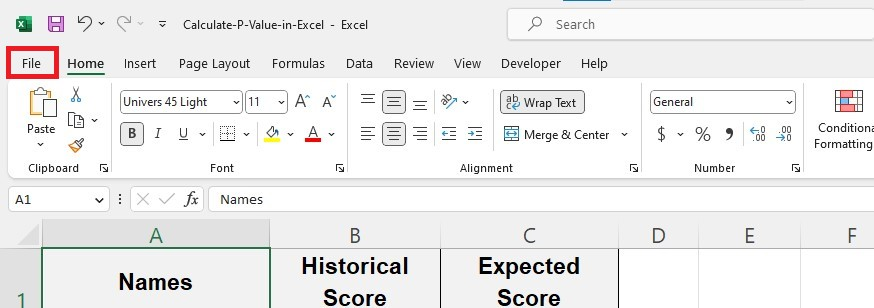
Click the File tab.
-
Move your cursor to "More..." and click Options.

-
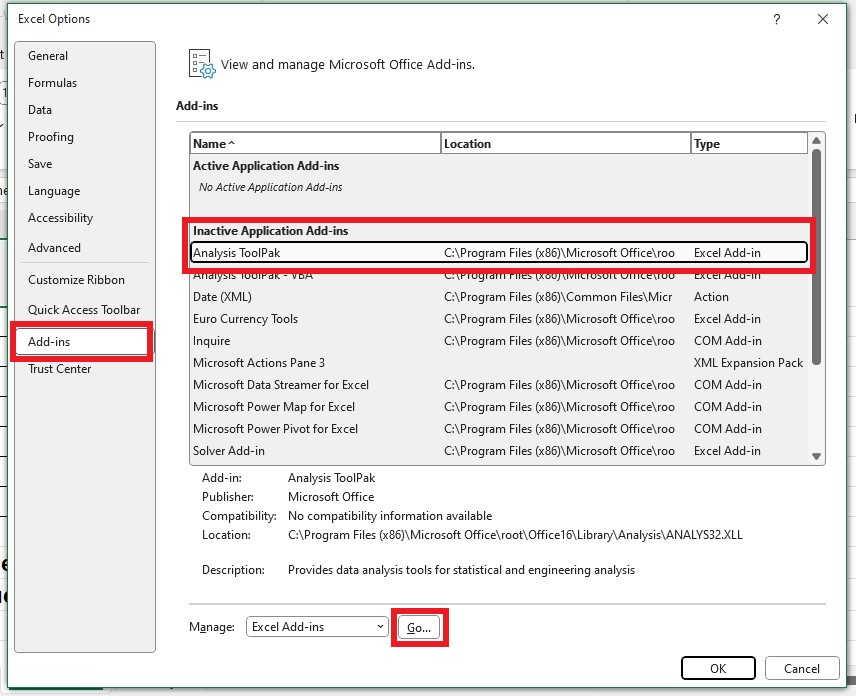
In the Excel options, click add-ins. Choose Analysis Toolpak and click Go.
-
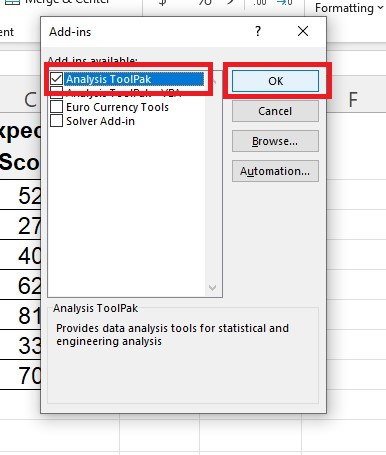
Select the Analysis Toolpak box and click the OK button.
-
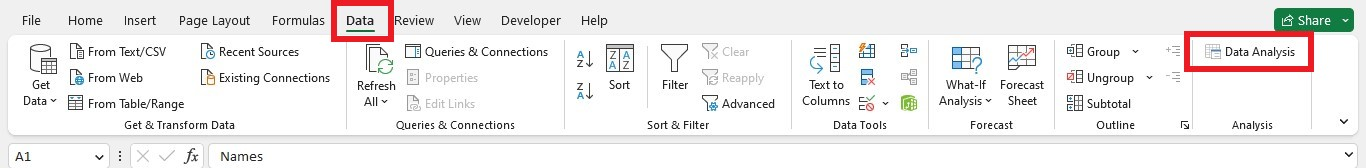
Go to the Data tab. Access the added data analysis tools in the Analysis group.
-
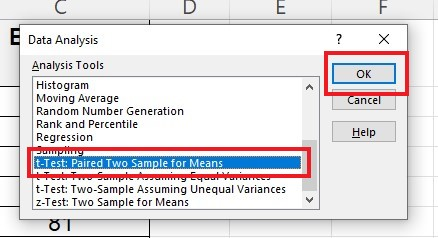
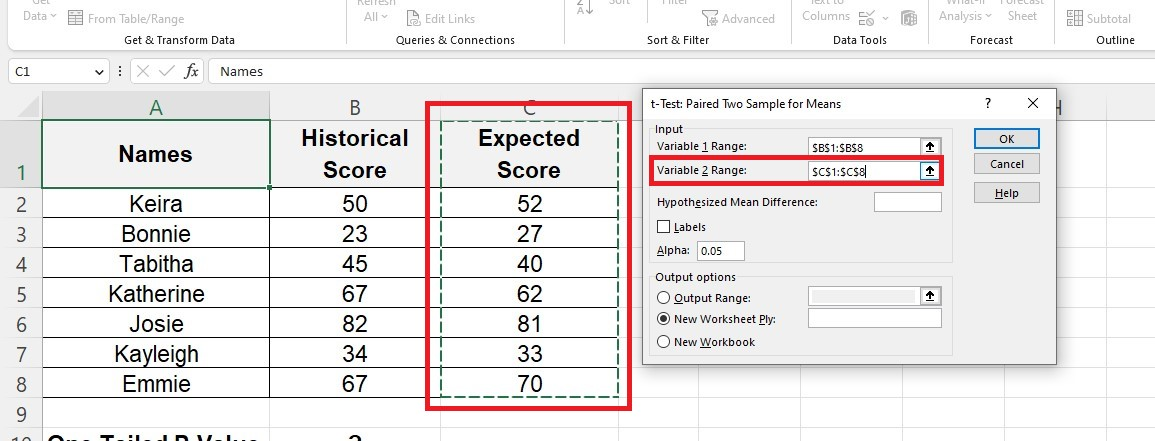
In the Data Analysis dialog box, choose "t-test: paired two samples for means" and click OK.
-
For Variable 1 Range, choose the first data set, specifically Column B.
-
For Variable 2 Range, choose the second data set, Column C.
-
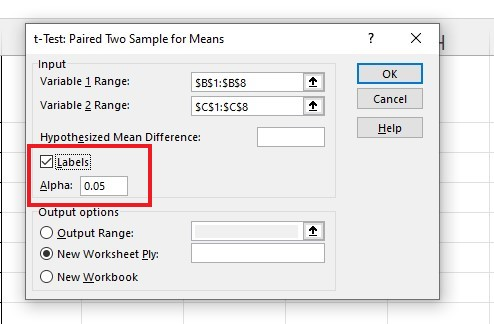
Select the Labels box and type 0.05 in the Alpha value.
-
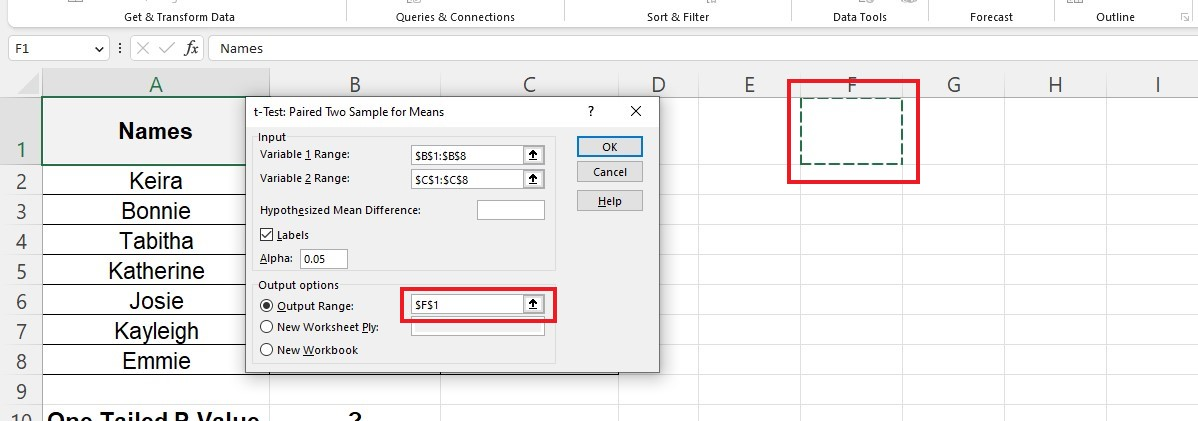
Under Output Options, select Output Range. Then, choose a cell where the results of the t-tail test should be displayed.
-
Click OK to get the results.
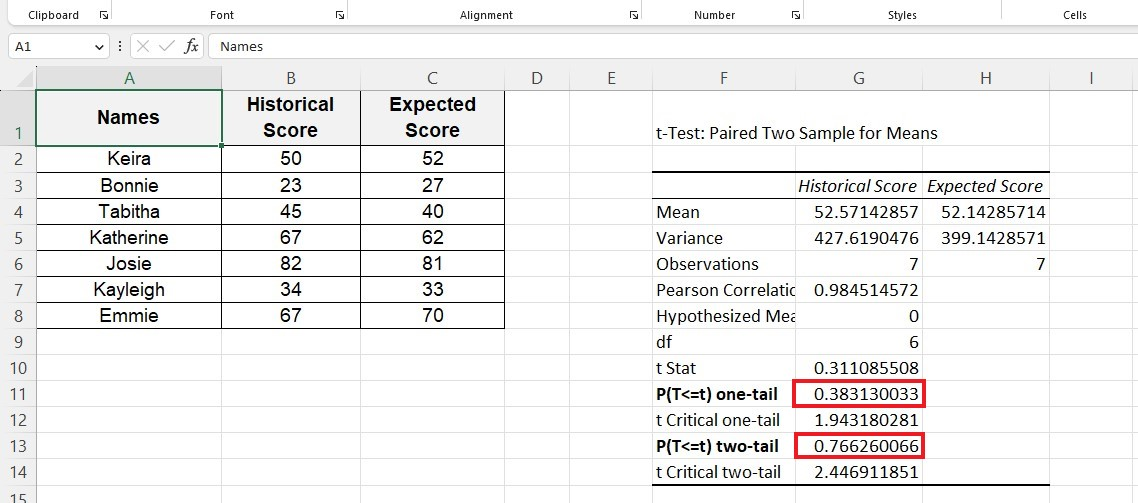
Excel provides a comprehensive table containing numerous statistical outcomes, including one-tail and two-tail p-values.
Interpret the p-value example.
Interpreting the t-test results may be more challenging than actually conducting the test.
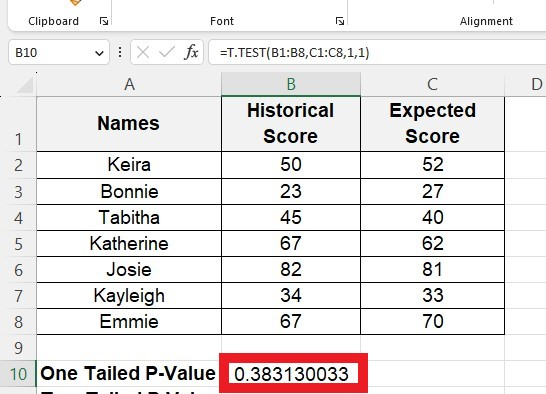
In our example, the one-tail test result was 38.3%. This number is greater than 10%. So, this means we need more evidence to prove the null hypothesis wrong. The null hypothesis is right.
The expected scores match the actual scores. So, the null hypothesis is true. Meanwhile, the alternative hypothesis is not true.
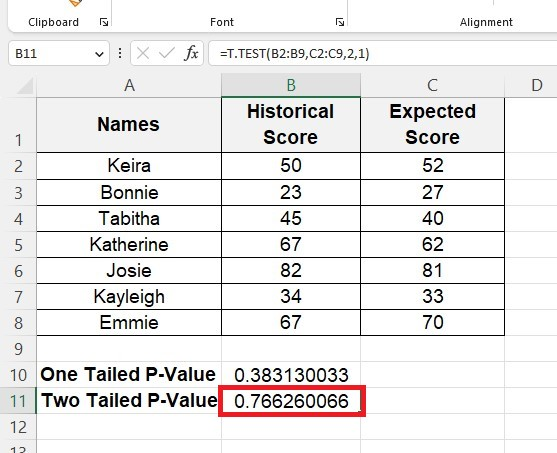
The two-tailed test showed a p-value of 76.6%, much higher than the p-value of only 10%. Consequently, the p-value means that the null hypothesis is likely true.
Use the T-TEST Function to Calculate the P-Value
You don't need to review the example above if you only want to obtain the p-values. Use the TEST function to obtain p-values for any given dataset instantly.
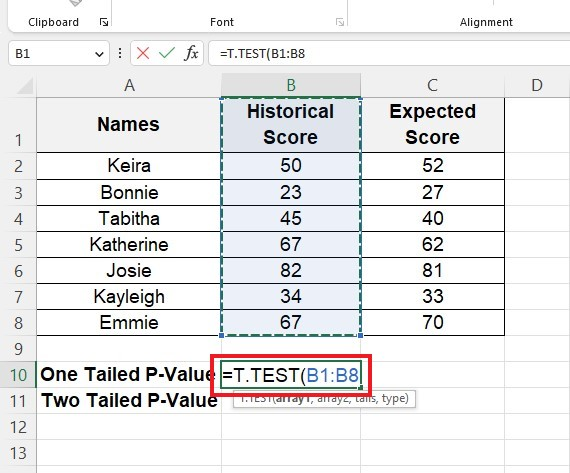
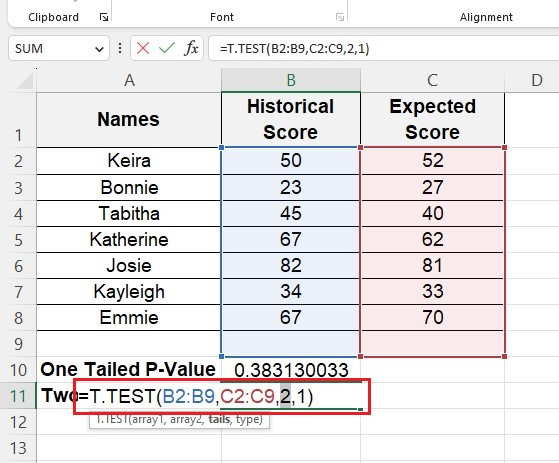
One-tailed p-value:
-
Type the T-TEST function and the first argument.
-
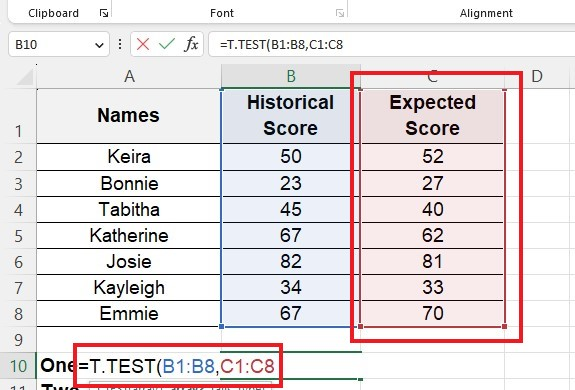
Input the second argument.
-
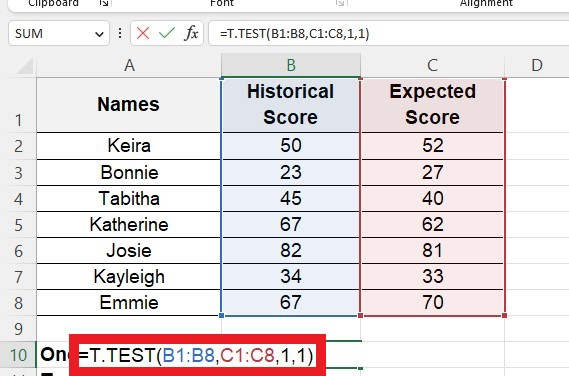
Type 1 for the tails argument and type 1 for the T-TEST type argument.
-
Use the enter key to get the results.
Two-tailed p-value:
Replace the tails argument with 2, then press the enter key.
You will get the two-tailed p-value.
Final Thoughts on How to Calculate P-Value In Excel
Calculating the p-value can drastically improve your efficiency when dealing with statistic-heavy tasks. Fortunately, Excel provides features that make the process easier.
Although there are still important considerations and changes when making the calculations, it takes much of the hard work away.
Visit Simple Sheets for more easy-to-follow guides and examples, and remember to read the related articles section of this blog post.
For the most straightforward Excel video tutorials, subscribe to Simple Sheets on YouTube!
Frequently Asked Questions on Calculate P-Value In Excel
Is it necessary to have a solid understanding of statistics to calculate p-values in Excel?
It is important to know about statistics, especially hypothesis testing. Moreover, you need to know which test to use and how to understand the results. The p-values from Excel will be helpful when you do this.
Is there a significance level for p-values in hypothesis testing?
Hypothesis testing uses something called a p-value. The significance level is the number that tells us whether the p-value is valid. Usually, 0.05 (5%) or 0.01 (1%) is used as the significance level.
Can Excel handle all types of hypothesis tests for calculating p-values?
Excel can do certain tests like t-tests, chi-square tests, and z-tests. But you might need special software or programming languages for more difficult tests.
Related Articles
How to Change Currency in Excel
Microsoft Forms 101 and How To Integrate with Microsoft Excel
Simplest Guide: How To Calculate Margin Of Error In Excel
Want to Make Excel Work for You? Try out 5 Amazing Excel Templates & 5 Unique Lessons
We hate SPAM. We will never sell your information, for any reason.

