
The Best Excel Formulas For Data Analysts
Jun 13, 2023
Are you a data analyst looking to do more with your spreadsheets?
This blog post is for you. We'll explore some of the most useful formulas in Excel and demonstrate how they can help you develop your data analytic skills.
Get our free Excel formulas cheat sheet
Plus new tutorials and template drops. Enter your email and we'll send it over.
Whether you're an experienced analyst or someone getting started, you'll have several powerful tools to add to your analytical arsenal!
Read on as we cover the following:
-
What Is Data Analysis?
-
Important Excel Formulas for Data Analysts
-
Final Thoughts on Excel Formulas for Data Analysts
-
Frequently Asked Questions on Excel Formulas for Data Analysts
What Is Data Analysis?
Data analysis is the process of refining and organizing raw data to obtain meaningful comprehension that can help businesses make informed decisions.
The results of data analysis can be presented in graphs, charts, images, and tables. By creating data visualization, stakeholders can lower the risk of decision-making errors.
Important Excel Formulas for Data Analysts
There are many reasons why data analysts use Python. Despite that, Microsoft Excel remains a ubiquitous tool in this field. Aside from having over 400 functions, this program is also widely used, making it accessible to most people. Besides, it has several features that simplify data visualization and analysis. Here are some of the most important Excel formulas you can use as an analyst"
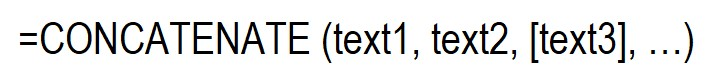
CONCATENATE
The CONCATENATE function combines data from multiple cells, including text, numbers, and dates. Despite its simplicity, it's an essential part of data analysis.
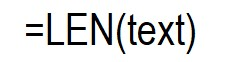
LEN
The LEN function in data analysis displays the character count of each cell. You can use the LEN function when working with text with a specific character limit or differentiating between product numbers.
DAYS
Use the DAYS function to get the days between two dates.

NETWORKDAYS
The NETWORKDAY function in Excel's Date/Time Function automatically excludes weekends.
The NETWORKDAYS function is commonly used in finance and accounting to calculate employee benefits, working days for projects, and business days required to resolve customer problems.

SUMIFS
As a data analyst, it's important to learn the SUMIFS function, which returns the sum of data based on multiple criteria.
While the SUM function is a commonly known formula, the SUMIFS function is necessary for more complex data sets.

AVERAGEIFS
The AVERAGEIFS function allows you to calculate an average using one or more criteria, similar to how the SUMIFS function works.

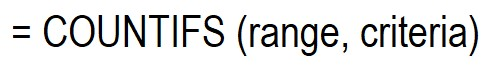
COUNTIES
The COUNTIFS function is a data analysis tool in Excel that is similar to the SUMIFS function.
The COUNTIFS function returns the number of values that meet specific conditions without requiring a sum range like SUMIFS.
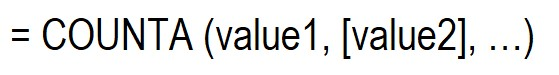
COUNTA
You will encounter incomplete datasets daily as a data analyst or Excel user. To examine gaps in the dataset without restructuring it, you can use COUNTA, which determines whether a cell is empty.
VLOOKUP
The VLOOKUP function in Excel stands for "Vertical Lookup."
It instructs the program to search for a particular value in a column, a "table array," and return a value from another column in the same row.

HLOOKUP
HLOOKUP is a function that finds a value in the row of a table and retrieves a value from a specified row in the same column.
If you locate your comparison value in a row over the top of a data table and want to look for values in a specific number of rows, you can use HLOOKUP.
Meanwhile, use VLOOKUP if the contrast values are to the left of the data you need to examine.

IF
The IF function tells Excel what to do. It helps you make decisions in your spreadsheets.
To use the IF function, you give Excel a test and tell it what to do if the answer is yes or no.


IFERROR
To improve error messages or perform calculations, we can utilize the IFERROR function.
To use the IFERROR function, you must specify which value to check for errors and what steps to take if an issue occurs.

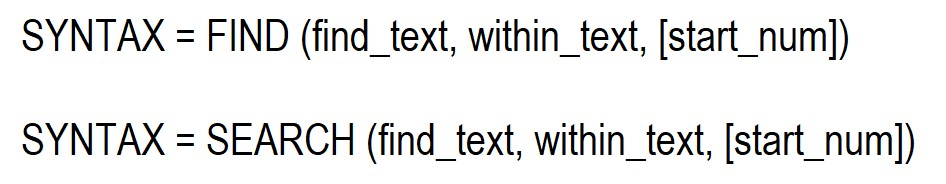
FIND/SEARCH
The FIND function in Excel helps you find words in a sentence. It will tell you what number the word is at. If the word is not there, it will give an error message.
SEARCH looks for words without worrying if they are big or small letters. FIND and SEARCH are good for looking for something special or different.
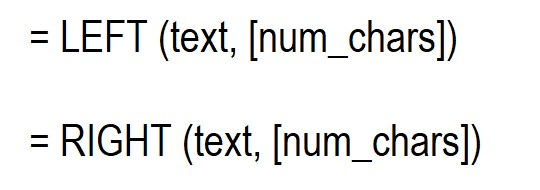
LEFT/RIGHT
The LEFT and RIGHT functions help you get information from cells.
The RIGHT function takes characters from the end of a cell, and the LEFT function takes characters from the start of a cell.
For example, if you have someone's phone number, you can get their area code with the LEFT function. With the RIGHT function, you can get their last four digits.
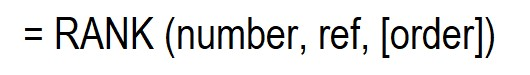
RANK
The RANK function is an old Excel tool that is still helpful. It can help you solve how things in a data set are ordered from lowest to highest or highest to lowest.
In this example, RANK determines which clients buy the most.
Other useful Excel functions.
-
SUM function
-
COUNT function
-
INDEX function
-
AVERAGE function
-
SUBSTITUTE function
-
UNIQUE function
Final Thoughts on Excel Formulas for Data Analysts
Excel formulas are beneficial in helping people get insights from their data. Knowing these formulas lets you speed up your entire data analysis workflow and focus on other important tasks.
Visit Simple Sheets for more easy-to-follow guides and examples, and remember to read the related articles section of this blog post.
For the most straightforward Excel video tutorials, subscribe to Simple Sheets on YouTube!
Frequently Asked Questions on Excel Formulas For Data Analysts
Is it necessary for me to learn Excel as a data analyst?
Excel and other spreadsheet tools are crucial for analyzing, managing, and presenting data in several fields, such as data analytics, business, marketing, or research.
In what ways can spreadsheet functions be useful for improving the effectiveness of data cleaning?
Excel's "TRIM" function removes extra spaces and tabs from cells. These extra spaces and tabs can make the data difficult to read, but the "TRIM" function makes it easier by eliminating them.
As a data analyst, which Excel formula can I use to make decisions?
The IF function in Excel is widely used and enables you to compare a value with an expected outcome using logical statements.
Related Articles:
What is a Sunburst Chart and When to Use a Sunburst Chart in Excel
How Much Does Microsoft Excel Cost?
Why Microsoft Excel Cannot Paste the Data
Want to Make Excel Work for You? Try out 5 Amazing Excel Templates & 5 Unique Lessons
We hate SPAM. We will never sell your information, for any reason.

