
How To Create A Scorecard In Excel: Easy-To-Follow Guide
May 16, 2023
Do you want to learn how to create a scorecard in Excel to track your performance?
Excel scorecards will help you track your progress and make informed decisions. You will see where you're thriving and determine areas for improvement.
This blog post will tell you what you need to know about making a scorecard in Excel.
Read on as we cover the following:
-
What Is an Excel Scorecard?
-
Excel Guide: How to Create a Scorecard
-
Final Thoughts on How to Create A Scorecard in Excel
-
Frequently Asked Questions on How to Create a Scorecard in Excel

What Is an Excel Scorecard?
An MS Excel scorecard summarizes the organization's performance by showing key performance indicators and quality standards for those metrics.
When creating a scorecard, you typically set overall objectives, including various performance targets for a group or organization.
You can fill in the targets with additional KPIs that reflect each sub-objectives. Remember that scorecards may differ depending on the organization or institution.
You can create Excel scorecards for individuals, groups, or organizations.
Excel Guide: How to Create a Scorecard
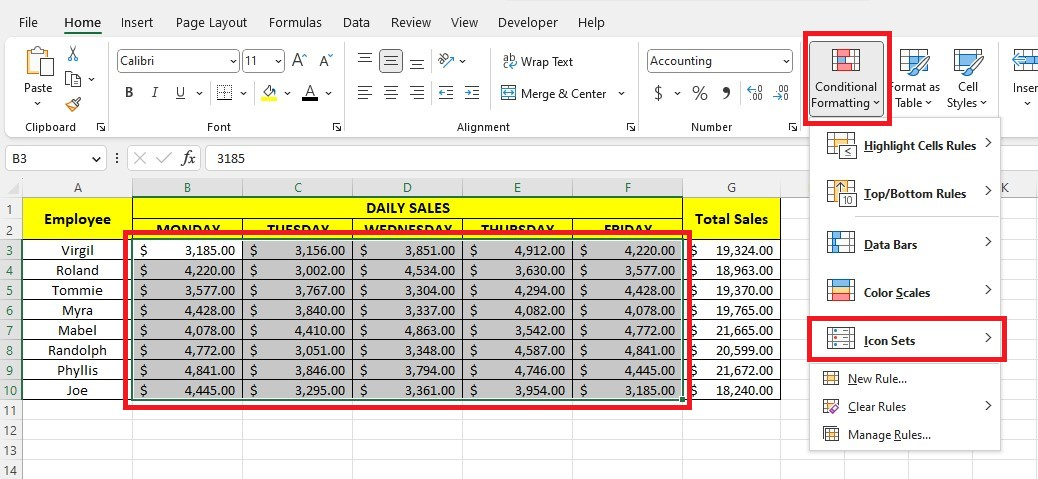
If you have a daily sales report for eight employees and want to create a scorecard based on their performance, follow the instructions below:
Create a sales scorecard for daily sales using Conditional Formatting.
-
Select the employee's daily sales cells, click Conditional Formatting, and move your mouse to Icon Sets.
-
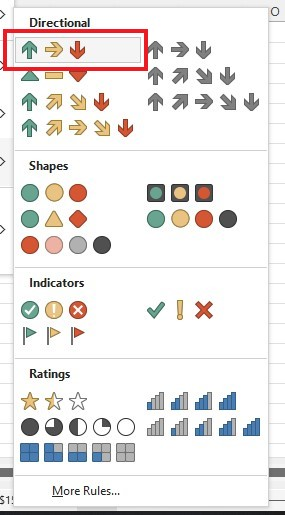
Choose the three colored arrows under the Directional group.
-
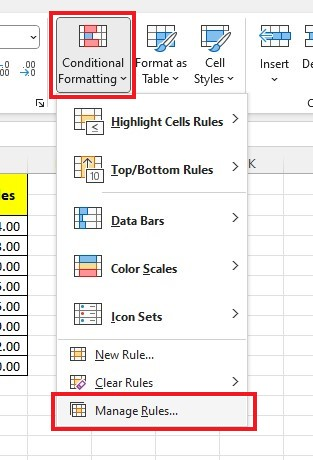
Click Conditional Formatting and choose Manage Rules.
-
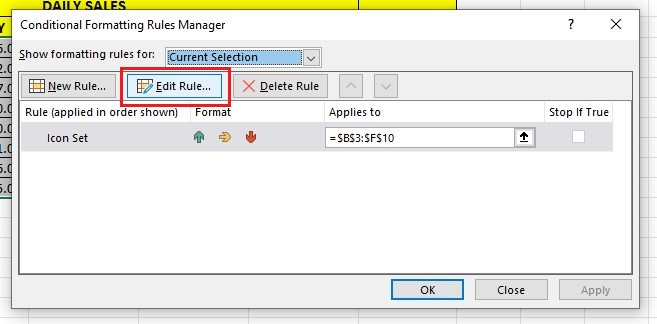
In the Conditional Formatting Rules Manager, click Edit Rule.
-
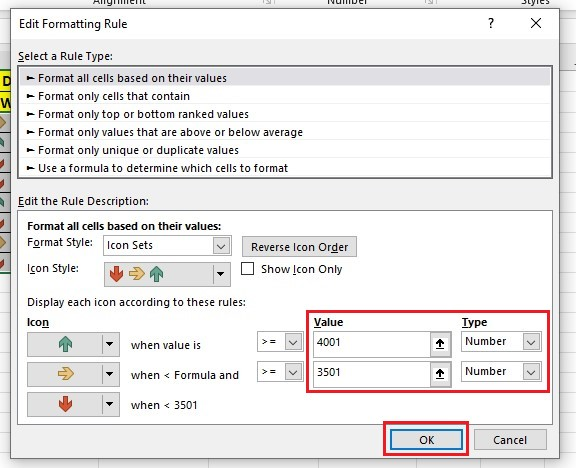
Select "Number" as the type for both options under the "Icon" group. Enter "4001" in the "Value" box for the green icon. Then, enter "3501" in the "Value" box for the yellow icon.
-
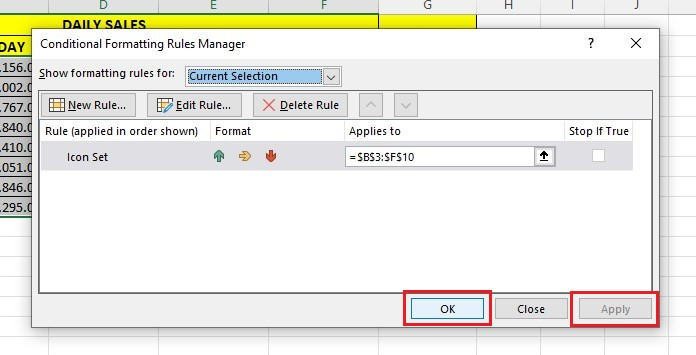
Click Apply and OK.
Your daily sales scorecard has been successfully created. Here is an example of how it will appear.
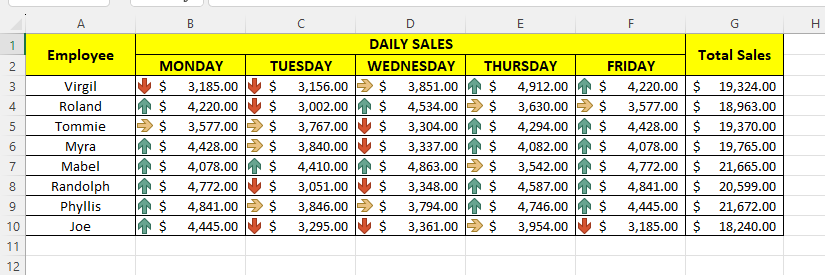
Scorecard template
Excel is the best spreadsheet and presentation tool for large datasets. However, we won't deny that the process can be complicated. So, if you don't want to start from scratch, use Simple Sheets' balanced scorecard Excel and Google Sheets template. Especially if you want to use Excel scorecard templates that guarantee you won't have to start from scratch. This scorecard template is a performance management tool focused on measurements of key objectives, both financial and non-financial.
Final Thoughts on How to Create a Scorecard In Excel
An Excel scorecard is a useful tool that can offer insights into any data.
Following the steps mentioned above, you can make your own data visualization to digest valuable information from your data sets efficiently.
Visit Simple Sheets for more easy-to-follow guides, and remember to visit the related articles section of this blog post.
For the most straightforward Excel video tutorials, subscribe to Simple Sheets on Youtube!
Frequently Asked Questions on How To Create A Scorecard In Excel
How do I create an Excel-balanced scorecard?
An Excel-balanced scorecard is a great way to manage your organization's strategic goals. Here are the steps to create one:
-
Know your organization’s strategic objective.
-
Create a planned map.
-
Create an outline for the evaluation.
How can I show the trend in my Excel scorecard?
To show the trend in your scorecard, follow the steps below:
-
Go to the Insert tab, choose Sparklines, and click Line tool.
-
Input your Data and Location range.
-
Click Hight and Low points in the Sparkline tab for your trend line.
The trendline will show up, and you will see the trend performance of your data.
What are the advantages of using Excel over Google Sheets to create a scorecard?
-
Compared to Google Sheets, Excel has taken several years to develop. So, the latter has more useful features for creating a scorecard.
-
Excel can handle large amounts of data, processing thousands of lines.
-
Excel is better than Google Sheets when it comes to data presentation. You can make various types of charts in Excel that will help you interpret data.
Related Templates:
Want to Make Excel Work for You? Try out 5 Amazing Excel Templates & 5 Unique Lessons
We hate SPAM. We will never sell your information, for any reason.

